
ARB surges 14.87% with MACD signaling strong sell pressure: weekly review

Arbitrum (ARB) ended the week with a notable advance, rising $0.0166 (14.87%) and closing in the upper section of its recent range. The token remains under pressure, trading below both the MA-20 ($0.1429) and MA-50 ($0.2898), which signals continued bearish sentiment on the weekly timeframe.
Highlights
- ARB trades below critical moving averages, reflecting continued medium- and long-term bearish pressure.
- Despite a recent 14.87% weekly gain, short-term momentum remains divergent with bearish signals prevailing among major indicators.
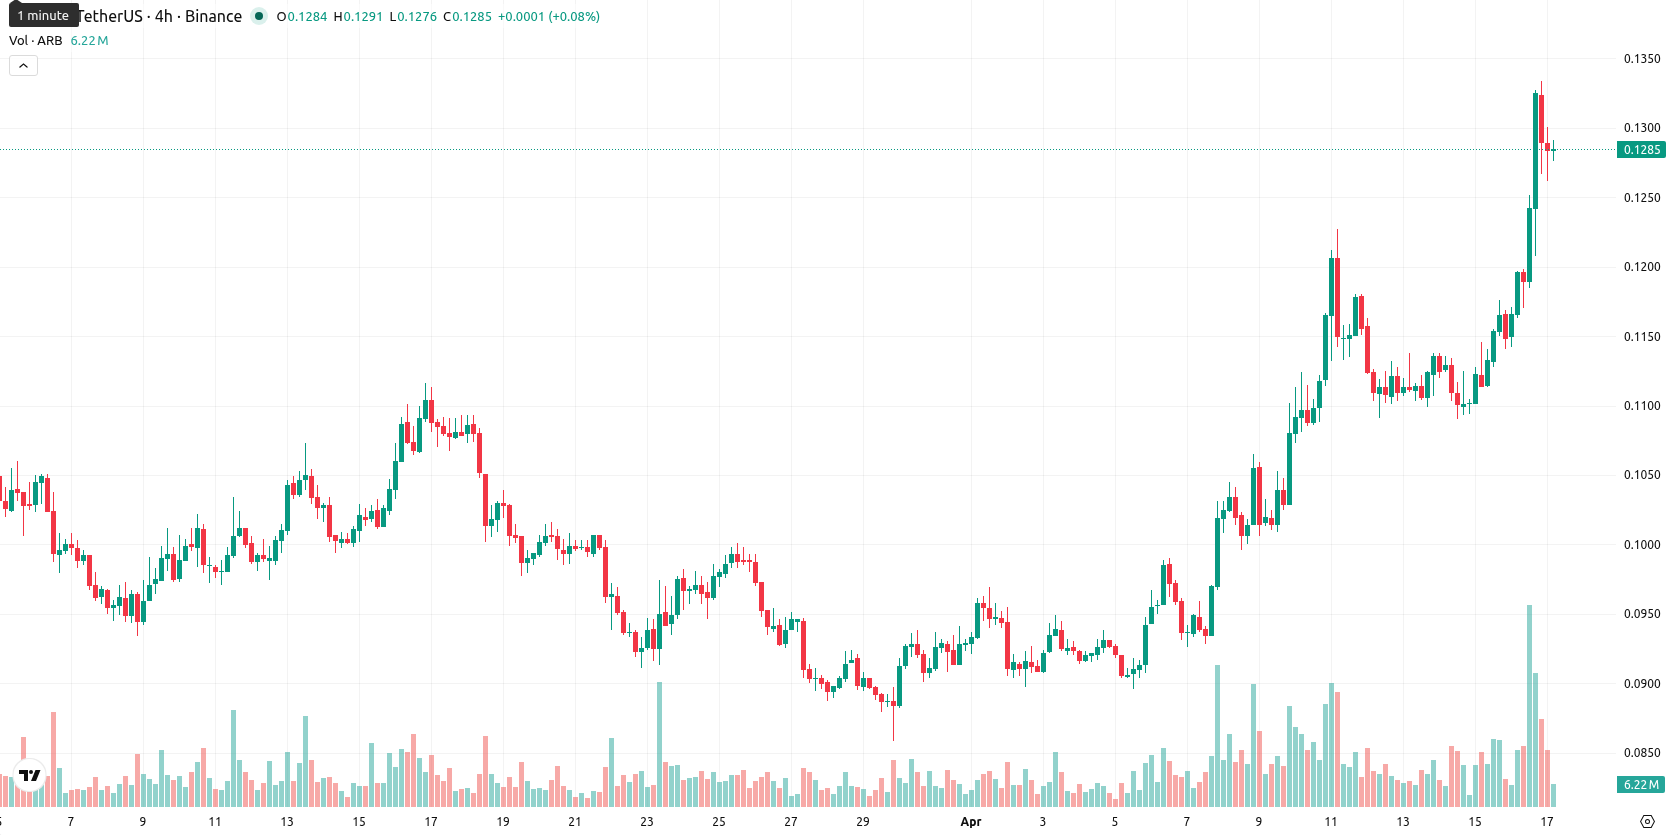
- The asset is expected to remain rangebound between $0.1250 and $0.1335, with a high likelihood of further downside volatility if support breaks.
Bearish momentum reinforces downside risk as volatility spikes this week
On the weekly chart, ARB is trading beneath the MA-20 and MA-50, with $0.1429 marking immediate dynamic resistance and $0.2898 acting as a longer-term barrier. Weekly volatility is elevated at 21.98%, and support is found near $0.1250, with resistance at $0.1335. Momentum indicators reinforce a bearish outlook: the MACD delivers a strong sell signal, the ADX confirms a prevailing downtrend, and the RSI remains weak in the sell territory. Despite these signals, the Stochastic RSI is overbought, showing a divergence that calls for caution, while Bull/Bear Power hints at persistent buyer interest.
Sideways bias expected as breakout risk rises on key levels next week
The upcoming 7 days are expected to see ARB confined to a narrow corridor between $0.1250 and $0.1335, with a sideways scenario favored based on weekly indicators. There is less than a 20% probability of sustained upside, as none of the key signals indicate a buy. Should the price break above $0.1335, short-term upward momentum could trigger a brief rally, but the dominant expectation is for renewed downside pressure, especially if $0.1250 is breached. Volatility may increase if support fails, reinforcing caution for bullish positions.
Earlier, analysts noted that Arbitrum was experiencing short- to medium-term bullish momentum while its longer-term outlook remained bearish. This week’s technical signals reinforce the prevailing downside risks, so traders should monitor the $0.1250 support closely as a breakdown could accelerate bearish momentum.


-
 Afghanistan
-
 Albania
-
 Algeria
-
 Angola
-
 Argentina
-
 Armenia
-
 Australia
-
 Austria
-
 Azerbaijan
-
 Bahamas
-
 Bahrain
-
 Bangladesh
-
 Belarus
-
 Belgium
-
 Bolivia
-
 Botswana
-
 Brazil
-
 Brunei
-
 Bulgaria
-
 Cambodia
-
 Cameroon
-
 Canada
-
 Chile
Chile
-
 China
China
-
 Colombia
-
 Congo
Congo
-
 Costa Rica
-
 Cote d'Ivoire
-
 Croatia
-
 Cuba
Cuba
-
 Cyprus
-
 Czechia
-
 DR Congo
-
 Denmark
-
 Dominican Republic
-
 Ecuador
-
 Egypt
Egypt
-
 El Salvador
-
 Estonia
-
 Eswatini
-
 Ethiopia
-
 Finland
-
 France
-
 Georgia
-
 Germany
-
 Ghana
Ghana
-
 Greece
-
 Haiti
Haiti
-
 Hong Kong
-
 Hungary
-
 India
India
-
 Indonesia
-
 Iran, Islamic republic
-
 Iraq
Iraq
-
 Ireland
-
 Israel
-
 Italy
Italy
-
 Jamaica
-
 Japan
Japan
-
 Jordan
-
 Kazakhstan
-
 Kenya
Kenya
-
 Korea
Korea
-
 Kuwait
-
 Kyrgyzstan
-
 Laos
Laos
-
 Latvia
-
 Lebanon
-
 Lesotho
-
 Libya
Libya
-
 Lithuania
-
 Luxembourg
-
 Madagascar
-
 Malaysia
-
 Malta
Malta
-
 Mauritius
-
 Mexico
-
 Moldova
-
 Mongolia
-
 Montenegro
-
 Morocco
-
 Mozambique
-
 Myanmar
-
 Namibia
-
 Nepal
Nepal
-
 Netherlands
-
 New Zealand
-
 Nigeria
-
 North Macedonia
-
 Norway
-
 Oman
Oman
-
 Pakistan
-
 Palestine
-
 Panama
-
 Papua New Guinea
-
 Paraguay
-
 Peru
Peru
-
 Philippines
-
 Poland
-
 Portugal
-
 Puerto Rico
-
 Qatar
Qatar
-
 Reunion
-
 Romania
-
 Rwanda
-
 Saudi Arabia
-
 Serbia
-
 Singapore
-
 Slovakia
-
 Slovenia
-
 Somalia
-
 South Africa
-
 Spain
Spain
-
 Sri Lanka
-
 Sweden
-
 Switzerland
-
 Syria
Syria
-
 Taiwan
-
 Tajikistan
-
 Tanzania
-
 Thailand
-
 Trinidad and Tobago
-
 Tunisia
-
 Turkey
-
 UAE
UAE
-
 Uganda
-
 Ukraine
-
 United Kingdom
-
United States
-
 Uruguay
-
 Uzbekistan
-
 Venezuela
-
 Vietnam
-
 Yemen
Yemen
-
 Zambia
-
 Zimbabwe
- Forex
- Crypto
