
UNI advances 10.85% as MACD signals seller control: weekly analysis

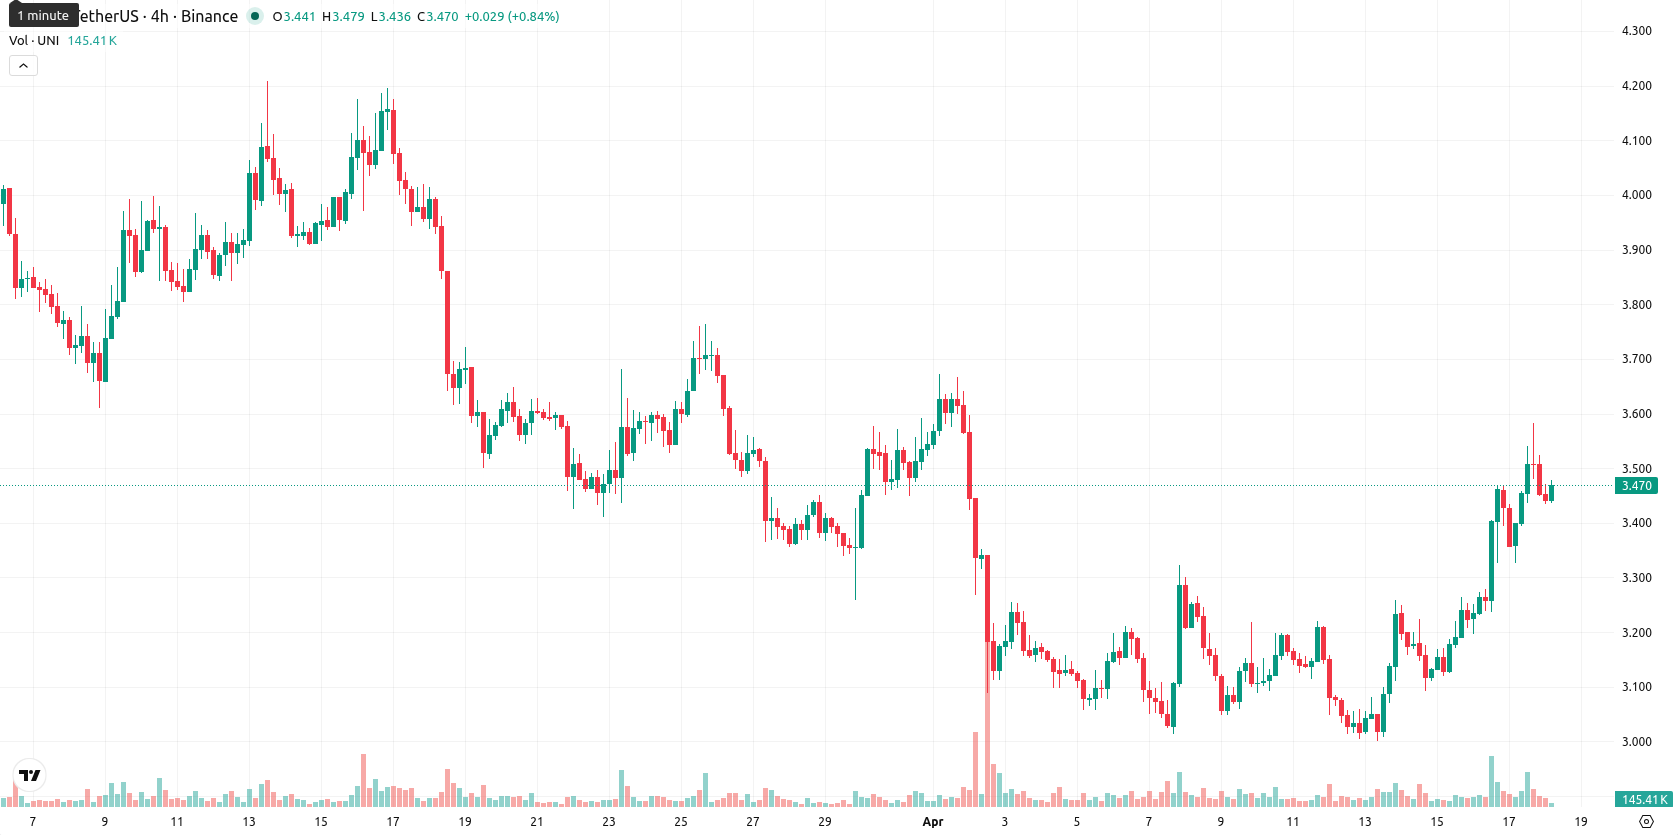
Uniswap (UNI) is currently trading at $3.473, marking a gain of $0.34 (10.85%) over the last week. The asset remains below its weekly MA-20 ($4.3193), MA-50 ($6.4660), and MA-200 ($7.0517), indicating continued medium- and long-term downward pressure, with immediate resistance at the MA-20.
Highlights
- UNI remains under extended selling pressure, trading beneath key moving averages and signaling sustained bearish momentum.
- Momentum indicators reflect a broadly negative bias, with weak trend strength and seller dominance limiting upside potential.
- UNI is likely to consolidate between $3.25 and $3.75 over the next week, with downside risk prevailing barring a breakout above $3.75.
Bearish momentum this week as sellers dominate near resistance
Weekly technical indicators confirm persistent bearish conditions for UNI. The weekly MACD is firmly in sell territory, while the ADX at 16.2 denotes weak trend momentum. Both the weekly RSI and CCI also highlight selling pressure, although the Stochastic RSI signals a brief overbought phase, hinting at exhaustion from the recent rebound. The Bull/Bear Power indicator underlines continued seller dominance, and UNI's current price hovers near the upper boundary of its weekly range, close to resistance, against a backdrop of 19.40% weekly volatility.
Sideways bias next week amid weak indicator signals and volatility
For the next seven days, UNI is likely to consolidate within the $3.25 to $3.75 range, as signaled by weekly volatility and lack of bullish momentum in key indicators. With none of the four main weekly indicators flashing a buy or strong buy, further upside appears unlikely — the probability of UNI breaking higher is estimated below 20%. The base scenario predicts sideways movement between support and resistance. A clear bullish breakout would require sustained closes above $3.75, while a breach below $3.25 could open up more downside, especially if selling pressure intensifies in the coming days.
Earlier, analysts noted that Uniswap's technical outlook remained bearish amid persistent seller dominance and constrained upside momentum. With fresh weekly indicators continuing to reinforce this bias despite a minor rebound, traders should closely watch for a decisive move outside the $3.25–$3.75 range as a signal for the next directional shift.


Latest Uniswap (UNI) News


-
 Afghanistan
-
 Albania
-
 Algeria
-
 Angola
-
 Argentina
-
 Armenia
-
 Australia
-
 Austria
-
 Azerbaijan
-
 Bahamas
-
 Bahrain
-
 Bangladesh
-
 Belarus
-
 Belgium
-
 Bolivia
-
 Botswana
-
 Brazil
-
 Brunei
-
 Bulgaria
-
 Cambodia
-
 Cameroon
-
 Canada
-
 Chile
Chile
-
 China
China
-
 Colombia
-
 Congo
Congo
-
 Costa Rica
-
 Cote d'Ivoire
-
 Croatia
-
 Cuba
Cuba
-
 Cyprus
-
 Czechia
-
 DR Congo
-
 Denmark
-
 Dominican Republic
-
 Ecuador
-
 Egypt
Egypt
-
 El Salvador
-
 Estonia
-
 Eswatini
-
 Ethiopia
-
 Finland
-
 France
-
 Georgia
-
 Germany
-
 Ghana
Ghana
-
 Greece
-
 Haiti
Haiti
-
 Hong Kong
-
 Hungary
-
 India
India
-
 Indonesia
-
 Iran, Islamic republic
-
 Iraq
Iraq
-
 Ireland
-
 Israel
-
 Italy
Italy
-
 Jamaica
-
 Japan
Japan
-
 Jordan
-
 Kazakhstan
-
 Kenya
Kenya
-
 Korea
Korea
-
 Kuwait
-
 Kyrgyzstan
-
 Laos
Laos
-
 Latvia
-
 Lebanon
-
 Lesotho
-
 Libya
Libya
-
 Lithuania
-
 Luxembourg
-
 Madagascar
-
 Malaysia
-
 Malta
Malta
-
 Mauritius
-
 Mexico
-
 Moldova
-
 Mongolia
-
 Montenegro
-
 Morocco
-
 Mozambique
-
 Myanmar
-
 Namibia
-
 Nepal
Nepal
-
 Netherlands
-
 New Zealand
-
 Nigeria
-
 North Macedonia
-
 Norway
-
 Oman
Oman
-
 Pakistan
-
 Palestine
-
 Panama
-
 Papua New Guinea
-
 Paraguay
-
 Peru
Peru
-
 Philippines
-
 Poland
-
 Portugal
-
 Puerto Rico
-
 Qatar
Qatar
-
 Reunion
-
 Romania
-
 Rwanda
-
 Saudi Arabia
-
 Serbia
-
 Singapore
-
 Slovakia
-
 Slovenia
-
 Somalia
-
 South Africa
-
 Spain
Spain
-
 Sri Lanka
-
 Sweden
-
 Switzerland
-
 Syria
Syria
-
 Taiwan
-
 Tajikistan
-
 Tanzania
-
 Thailand
-
 Trinidad and Tobago
-
 Tunisia
-
 Turkey
-
 UAE
UAE
-
 Uganda
-
 Ukraine
-
 United Kingdom
-
United States
-
 Uruguay
-
 Uzbekistan
-
 Venezuela
-
 Vietnam
-
 Yemen
Yemen
-
 Zambia
-
 Zimbabwe
- Forex
- Crypto
