
-1.58% for Ethereum as regulatory uncertainty over CLARITY Act outcome weighs

Ethereum (ETH) is trading at $2,313.50 following a daily decline of 1.58%. The price remains above its short- and medium-term moving averages, though it is still tracking below longer-term reference levels.
Highlights
- US-Iran tensions around the Strait of Hormuz have heightened geopolitical risk, strengthening the dollar and dampening Ethereum's upside potential.
- Regulatory uncertainty in the US, including delays with the CLARITY Act, threatens institutional adoption and increases sell-off risk for Ethereum.
- Technical signals point to ongoing short-term strength but a subdued long-term trend, with ETH expected to trade within $2,180 to $2,420 and a higher likelihood of further declines.
Upside curtailed as geopolitical risk and US regulation stifle sentiment
On Wednesday, tensions surrounding the US-Iran conflict have triggered market jitters for Ethereum, with temporary risk aversion and instability impacting the asset. The ongoing friction around the Strait of Hormuz, including US interception of sanctioned vessels and Iranian seizures of container ships, sustains a baseline of geopolitical risk that periodically constrains Ethereum's upside by strengthening the US dollar and diminishing risk appetite. Continued regulatory uncertainty in the United States, with the outcome of the CLARITY Act in doubt and the potential for unexpected policy intervention, maintains the threat of disrupted institutional adoption and market sell-offs. Persistent regulatory delays and the risk of renewed escalation in the Iran conflict have weighed on upside momentum in recent sessions.
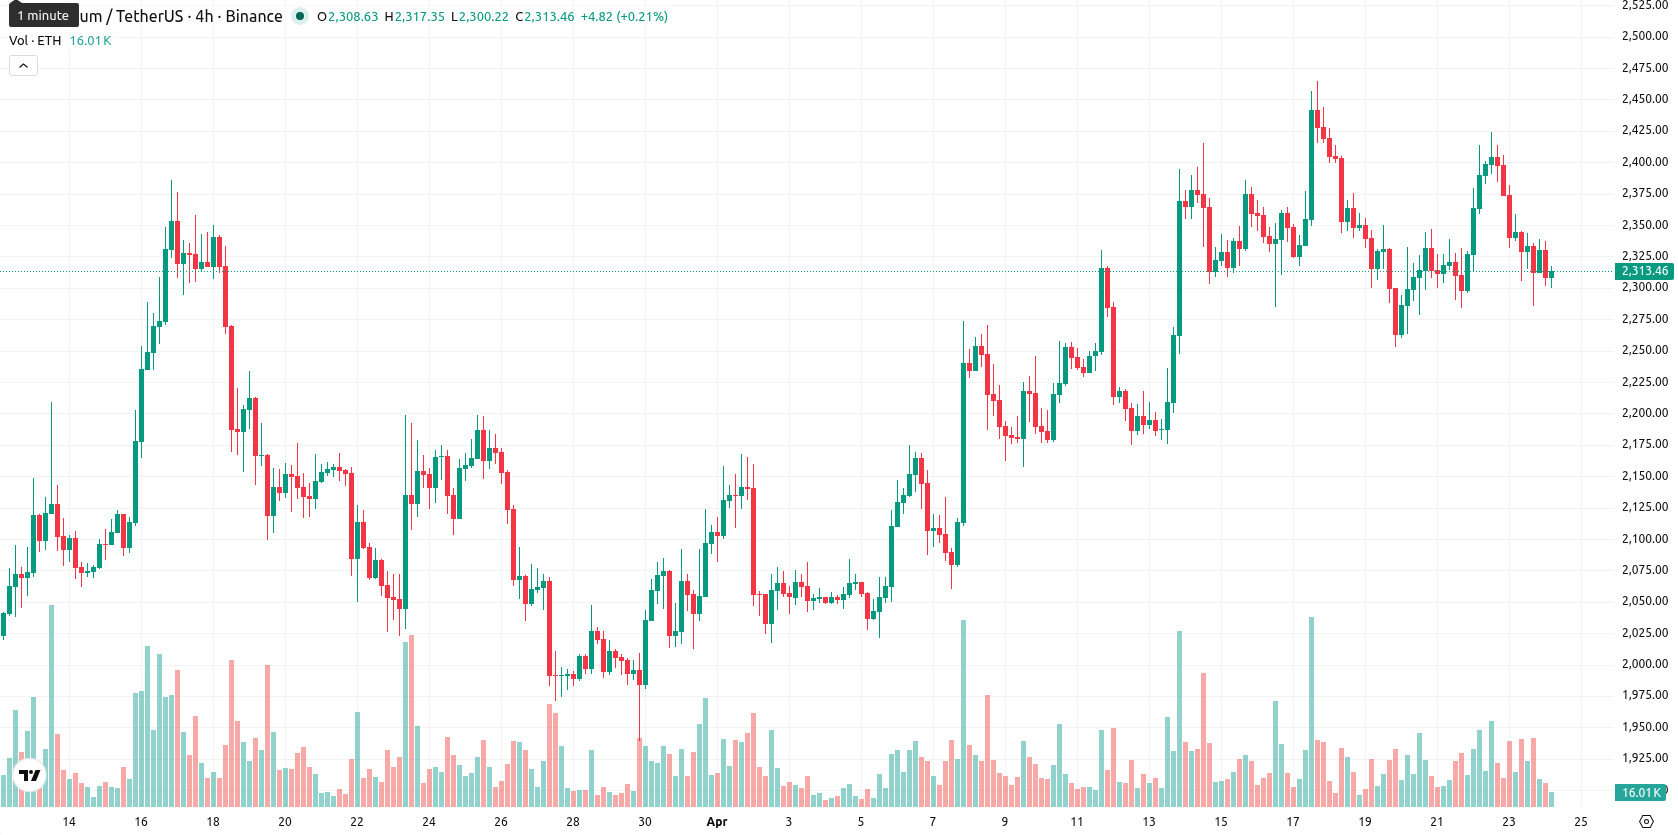
Mixed momentum signals as ETH holds above key short-term supports
ETH’s current level sits above the SMA-20 ($2,270.01) and SMA-50 ($2,161.40), while remaining well below the SMA-200 ($2,813.53). The Ichimoku Kijun level on the daily chart is $2,201.86 and serves as immediate support. Momentum indicators show a mixed setup: the MACD on daily signals a strong buy, the ADX points to weak trend intensity, and the daily RSI and CCI display modest bullish tendencies. Stoch RSI is close to oversold, while Bull/Bear Power (BBP) suggests short-term buyer dominance, though with overbought conditions intraday and divergence from the recent price drop.
Limited rebound odds as downside risk dominates short-term outlook
For the next five sessions, ETH is likely to trade within a $2,180 to $2,420 volatility band relative to current levels, as broader long-term resistance levels remain distant. The probability of a price increase is considered very low (less than 20%), aligning with a higher likelihood of continued decline in the near term. The base case remains range-bound movement above $2,200. A breakout above $2,420 could trigger upward momentum, while a drop below $2,180 would expose lower downside targets.
Earlier, analysts noted that Ethereum was experiencing mixed momentum and was likely to remain in a consolidation phase amid persistent external risks and evolving institutional participation. Recent developments, including heightened geopolitical tensions and ongoing regulatory uncertainty, reinforce this view, making the $2,180 support level a critical threshold to monitor for potential downside in the current trading environment.


-
 Afghanistan
-
 Albania
-
 Algeria
-
 Angola
-
 Argentina
-
 Armenia
-
 Australia
-
 Austria
-
 Azerbaijan
-
 Bahamas
-
 Bahrain
-
 Bangladesh
-
 Belarus
-
 Belgium
-
 Bolivia
-
 Botswana
-
 Brazil
-
 Brunei
-
 Bulgaria
-
 Cambodia
-
 Cameroon
-
 Canada
-
 Chile
Chile
-
 China
China
-
 Colombia
-
 Congo
Congo
-
 Costa Rica
-
 Cote d'Ivoire
-
 Croatia
-
 Cuba
Cuba
-
 Cyprus
-
 Czechia
-
 DR Congo
-
 Denmark
-
 Dominican Republic
-
 Ecuador
-
 Egypt
Egypt
-
 El Salvador
-
 Estonia
-
 Eswatini
-
 Ethiopia
-
 Finland
-
 France
-
 Georgia
-
 Germany
-
 Ghana
Ghana
-
 Greece
-
 Haiti
Haiti
-
 Hong Kong
-
 Hungary
-
 India
India
-
 Indonesia
-
 Iran, Islamic republic
-
 Iraq
Iraq
-
 Ireland
-
 Israel
-
 Italy
Italy
-
 Jamaica
-
 Japan
Japan
-
 Jordan
-
 Kazakhstan
-
 Kenya
Kenya
-
 Korea
Korea
-
 Kuwait
-
 Kyrgyzstan
-
 Laos
Laos
-
 Latvia
-
 Lebanon
-
 Lesotho
-
 Libya
Libya
-
 Lithuania
-
 Luxembourg
-
 Madagascar
-
 Malaysia
-
 Malta
Malta
-
 Mauritius
-
 Mexico
-
 Moldova
-
 Mongolia
-
 Montenegro
-
 Morocco
-
 Mozambique
-
 Myanmar
-
 Namibia
-
 Nepal
Nepal
-
 Netherlands
-
 New Zealand
-
 Nigeria
-
 North Macedonia
-
 Norway
-
 Oman
Oman
-
 Pakistan
-
 Palestine
-
 Panama
-
 Papua New Guinea
-
 Paraguay
-
 Peru
Peru
-
 Philippines
-
 Poland
-
 Portugal
-
 Puerto Rico
-
 Qatar
Qatar
-
 Reunion
-
 Romania
-
 Rwanda
-
 Saudi Arabia
-
 Serbia
-
 Singapore
-
 Slovakia
-
 Slovenia
-
 Somalia
-
 South Africa
-
 Spain
Spain
-
 Sri Lanka
-
 Sweden
-
 Switzerland
-
 Syria
Syria
-
 Taiwan
-
 Tajikistan
-
 Tanzania
-
 Thailand
-
 Trinidad and Tobago
-
 Tunisia
-
 Turkey
-
 UAE
UAE
-
 Uganda
-
 Ukraine
-
 United Kingdom
-
United States
-
 Uruguay
-
 Uzbekistan
-
 Venezuela
-
 Vietnam
-
 Yemen
Yemen
-
 Zambia
-
 Zimbabwe
- Forex
- Crypto
