
Solana price prediction: $83.72 support in focus? SOL trades down

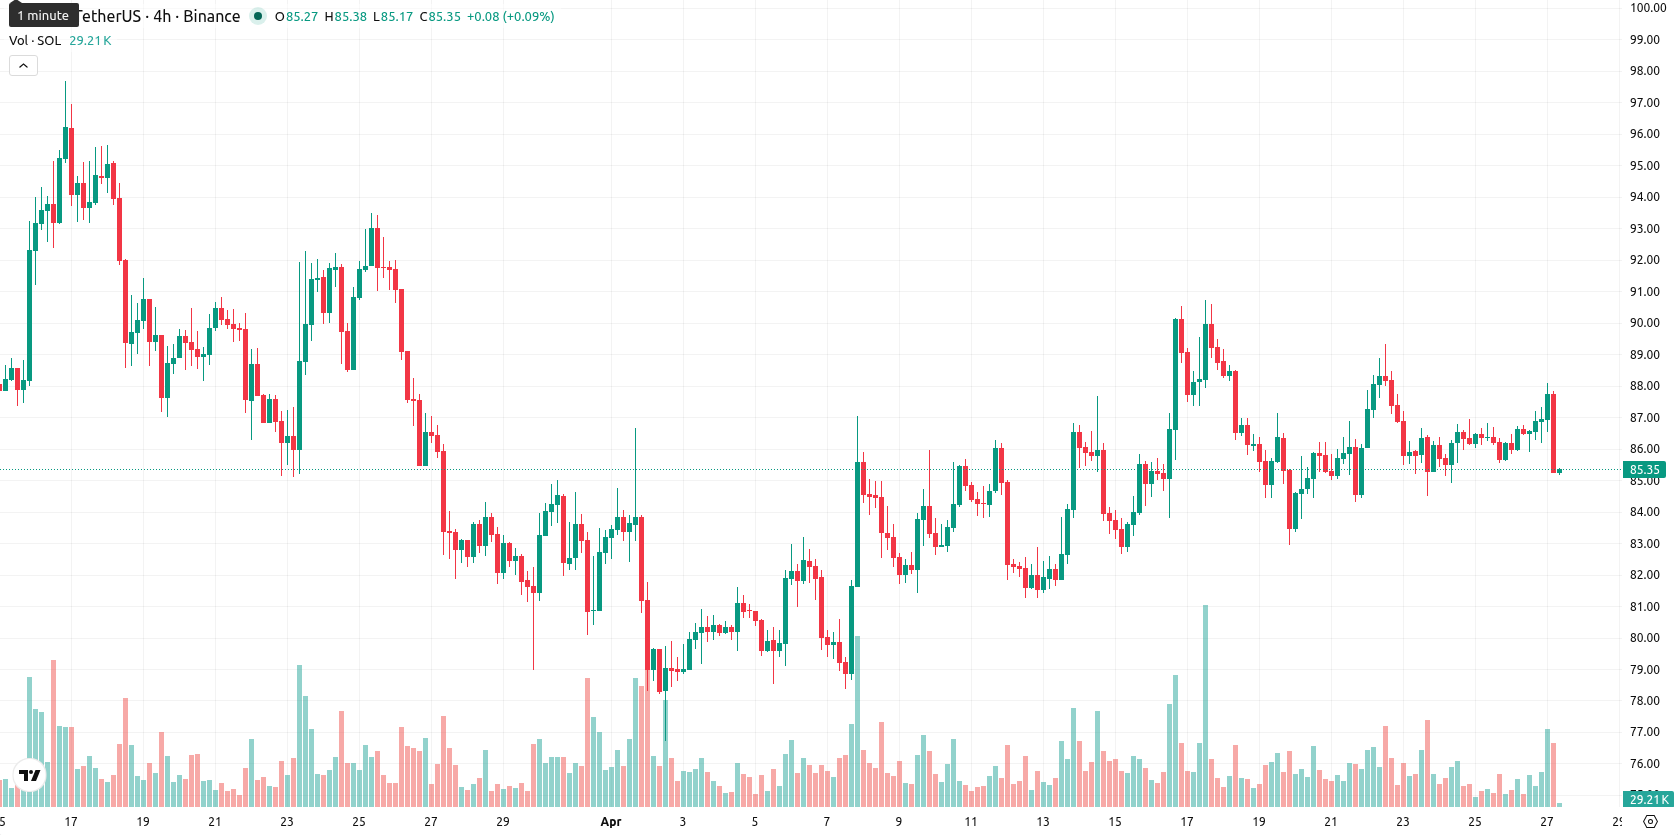
Solana (SOL) is trading at $85.55 after a 1.19% decline today, following a move down from previous levels. The asset currently sits just above its short-term moving average and slightly below its intermediate average, indicating its position is mixed against key averages.
Highlights
- The Solana network suffered the year's largest DeFi hack on April 26, 2026, with North Korean hackers suspected responsible.
- Solana Foundation rapidly launched new crisis and security initiatives, but market sentiment remains pressured after the breach.
- SOL trades in a sideways $80.00–$90.00 range, with bearish weekly signals outweighing mixed short-term momentum and a low probability of near-term recovery.
Security overhaul as historic DeFi hack drives selling pressure
On April 26, 2026, the Solana network was subjected to a significant hacker attack, identified as the largest DeFi theft of the year and attributed by preliminary evidence to North Korean hackers. In response to the incident, the Solana Foundation established the SIRN crisis network and initiated the Stride security program to address security concerns. These actions were taken following confirmation of the incident, though price action has remained under broader selling pressure.
Bullish signals emerge as trend strength remains muted
The MA-20 is at $85.44 and MA-50 at $85.85, with the price currently between these levels, while the MA-200 remains substantially higher at $121.30. The Ichimoku Kijun on the daily chart is positioned at $83.72, serving as immediate support. MACD on the daily timeframe shows a buy signal, but the ADX is weak at 8.7, indicating a lack of trend strength. RSI and CCI are modestly bullish and below overbought levels; Stoch RSI is trending higher, and the Bull/Bear Power (BBP) on D1 is high and flagged as overbought, implying short-term intraday buyer dominance and the risk of exhaustion. The Awesome Oscillator is bullish, but current volatility is moderate and price action has shifted toward the lower end of the session’s range with renewed downward pressure.
Sideways bias as weekly weakness overshadows intraday momentum
Over the short term, typical volatility is expected to keep SOL within a $80.00 – $90.00 channel. Although daily momentum indicators provide some bullish signals, persistent weakness on weekly timeframes points to less than a 20% chance of a price increase, with a greater likelihood of a move lower. The primary expectation is for price to hold sideways within this band. A breakout above $90.00 could trigger a bullish scenario, while a sustained drop below the Kijun support near $83.72 and $80.00 would indicate further downside risk.
Earlier, analysts noted that Solana was exhibiting mixed technical signals and a generally neutral outlook, with price consolidating under macro and ecosystem pressures. The recent security breach and subsequent foundation response add a fresh layer of downside risk, making the ability of SOL to hold support near the $83.72 Kijun level a key indicator for determining future trend direction.


Latest Solana News


-
 Afghanistan
-
 Albania
-
 Algeria
-
 Angola
-
 Argentina
-
 Armenia
-
 Australia
-
 Austria
-
 Azerbaijan
-
 Bahamas
-
 Bahrain
-
 Bangladesh
-
 Belarus
-
 Belgium
-
 Bolivia
-
 Botswana
-
 Brazil
-
 Brunei
-
 Bulgaria
-
 Cambodia
-
 Cameroon
-
 Canada
-
 Chile
Chile
-
 China
China
-
 Colombia
-
 Congo
Congo
-
 Costa Rica
-
 Cote d'Ivoire
-
 Croatia
-
 Cuba
Cuba
-
 Cyprus
-
 Czechia
-
 DR Congo
-
 Denmark
-
 Dominican Republic
-
 Ecuador
-
 Egypt
Egypt
-
 El Salvador
-
 Estonia
-
 Eswatini
-
 Ethiopia
-
 Finland
-
 France
-
 Georgia
-
 Germany
-
 Ghana
Ghana
-
 Greece
-
 Haiti
Haiti
-
 Hong Kong
-
 Hungary
-
 India
India
-
 Indonesia
-
 Iran, Islamic republic
-
 Iraq
Iraq
-
 Ireland
-
 Israel
-
 Italy
Italy
-
 Jamaica
-
 Japan
Japan
-
 Jordan
-
 Kazakhstan
-
 Kenya
Kenya
-
 Korea
Korea
-
 Kuwait
-
 Kyrgyzstan
-
 Laos
Laos
-
 Latvia
-
 Lebanon
-
 Lesotho
-
 Libya
Libya
-
 Lithuania
-
 Luxembourg
-
 Madagascar
-
 Malaysia
-
 Malta
Malta
-
 Mauritius
-
 Mexico
-
 Moldova
-
 Mongolia
-
 Montenegro
-
 Morocco
-
 Mozambique
-
 Myanmar
-
 Namibia
-
 Nepal
Nepal
-
 Netherlands
-
 New Zealand
-
 Nigeria
-
 North Macedonia
-
 Norway
-
 Oman
Oman
-
 Pakistan
-
 Palestine
-
 Panama
-
 Papua New Guinea
-
 Paraguay
-
 Peru
Peru
-
 Philippines
-
 Poland
-
 Portugal
-
 Puerto Rico
-
 Qatar
Qatar
-
 Reunion
-
 Romania
-
 Rwanda
-
 Saudi Arabia
-
 Serbia
-
 Singapore
-
 Slovakia
-
 Slovenia
-
 Somalia
-
 South Africa
-
 Spain
Spain
-
 Sri Lanka
-
 Sweden
-
 Switzerland
-
 Syria
Syria
-
 Taiwan
-
 Tajikistan
-
 Tanzania
-
 Thailand
-
 Trinidad and Tobago
-
 Tunisia
-
 Turkey
-
 UAE
UAE
-
 Uganda
-
 Ukraine
-
 United Kingdom
-
United States
-
 Uruguay
-
 Uzbekistan
-
 Venezuela
-
 Vietnam
-
 Yemen
Yemen
-
 Zambia
-
 Zimbabwe
- Forex
- Crypto
