
Ethereum price prediction: $2,320–$2,350 resistance in focus as ETH climbs 1.68%

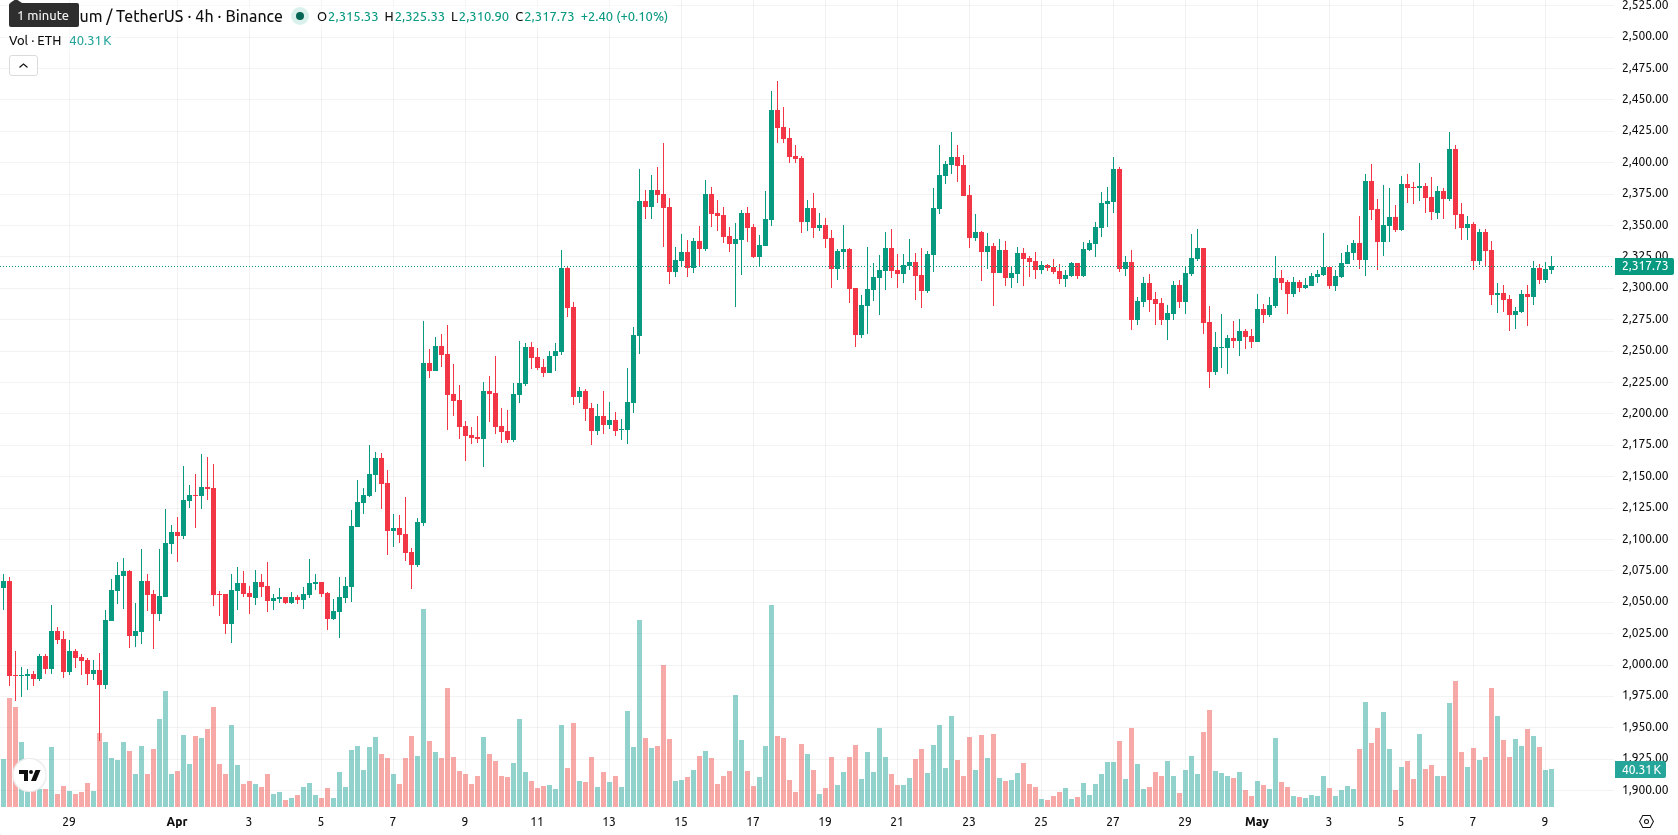
Ethereum (ETH) is trading at $2,316.33, climbing 1.68% on the day. The asset sits just above its key short- and medium-term moving averages, while it remains below longer-term trend levels.
Highlights
- U.S. spot Ethereum ETFs experienced net outflows between $80 million and $103.5 million, reversing previous inflows and signaling a shift in institutional demand.
- Major players moved over 113,000 ETH, worth nearly $260 million, to exchanges, temporarily increasing supply and the potential for heightened trading activity.
- ETH trades in a $2,240–$2,430 range with upward intraday bias, but overbought and mixed signals suggest probable near-term downside.
Institutional positioning shifts as ETFs see outflows and whale transfers lift supply
On May 8, 2026, U.S. spot Ethereum ETFs saw net outflows of $80 million to $103.5 million, breaking a prior streak of inflows and shifting institutional demand patterns, though major funds such as BlackRock retained significant holdings. Simultaneously, more than 113,000 ETH (valued near $260 million) was moved to exchanges by large holders, including a $178 million transfer by a whale and sizable transactions from BlackRock and Fidelity, temporarily increasing market supply and raising the potential for heightened liquidity or sale activity. Elsewhere, BitMine Immersion Technologies signaled a slowdown in its ETH acquisitions as it neared its strategic cap, while tokenized U.S. Treasuries on Ethereum reached $8 billion in market capitalization, reflecting the platform’s increasing use for real-world yield products.
Mixed momentum as short-term bullish signals face resistance and exhaustion
ETH’s spot price is positioned just above the SMA-20 ($2,315.44) and comfortably over the SMA-50 ($2,225.62), but remains under the SMA-200 ($2,678.63). Immediate resistance is defined by the Ichimoku Kijun at $2,320.30, with session highs capped at $2,324.46. Technical momentum is mixed: the D1 MACD indicates robust upside strength, yet a low ADX (19.06) signals a lack of trend conviction. The D1 RSI stands at 51.54, reflecting slightly positive momentum, while the Stoch RSI is neutral and the CCI gives a mild sell signal. Bull/Bear Power (BBP) at 5.19 and overbought oscillator readings highlight strong short-term buyer activity. The technical backdrop combines short-term bullish flow with hints of exhaustion as ETH approaches overhead resistance.
Limited upside as volatility and bearish indicators constrain ETH range
Over the next five trading days, expected volatility should keep ETH within the $2,240–$2,430 range, consistent with typical movements around current levels. The likelihood of a further increase is low, with a probability of less than 20%, as weekly indicators such as RSI, the MA-50, and MACD point to an ongoing bearish bias despite recent gains. The base scenario is for choppy consolidation in this price band. A move above resistance at $2,320–$2,350 could open the door to a test of $2,430, while a drop below $2,240 may trigger extended declines as longer-term weakness takes precedence.
Earlier, analysts noted that Ethereum was experiencing sideways consolidation amid heightened regulatory scrutiny and generally neutral technical conditions. The latest flows from major institutions and large holders add further weight to this consolidation scenario, making price action near the $2,320–$2,350 resistance zone pivotal for any potential shift in trend.


Latest Ethereum News


-
 Afghanistan
-
 Albania
-
 Algeria
-
 Angola
-
 Argentina
-
 Armenia
-
 Australia
-
 Austria
-
 Azerbaijan
-
 Bahamas
-
 Bahrain
-
 Bangladesh
-
 Belarus
-
 Belgium
-
 Bolivia
-
 Botswana
-
 Brazil
-
 Brunei
-
 Bulgaria
-
 Cambodia
-
 Cameroon
-
 Canada
-
 Chile
Chile
-
 China
China
-
 Colombia
-
 Congo
Congo
-
 Costa Rica
-
 Cote d'Ivoire
-
 Croatia
-
 Cuba
Cuba
-
 Cyprus
-
 Czechia
-
 DR Congo
-
 Denmark
-
 Dominican Republic
-
 Ecuador
-
 Egypt
Egypt
-
 El Salvador
-
 Estonia
-
 Eswatini
-
 Ethiopia
-
 Finland
-
 France
-
 Georgia
-
 Germany
-
 Ghana
Ghana
-
 Greece
-
 Haiti
Haiti
-
 Hong Kong
-
 Hungary
-
 India
India
-
 Indonesia
-
 Iran, Islamic republic
-
 Iraq
Iraq
-
 Ireland
-
 Israel
-
 Italy
Italy
-
 Jamaica
-
 Japan
Japan
-
 Jordan
-
 Kazakhstan
-
 Kenya
Kenya
-
 Korea
Korea
-
 Kuwait
-
 Kyrgyzstan
-
 Laos
Laos
-
 Latvia
-
 Lebanon
-
 Lesotho
-
 Libya
Libya
-
 Lithuania
-
 Luxembourg
-
 Madagascar
-
 Malaysia
-
 Malta
Malta
-
 Mauritius
-
 Mexico
-
 Moldova
-
 Mongolia
-
 Montenegro
-
 Morocco
-
 Mozambique
-
 Myanmar
-
 Namibia
-
 Nepal
Nepal
-
 Netherlands
-
 New Zealand
-
 Nigeria
-
 North Macedonia
-
 Norway
-
 Oman
Oman
-
 Pakistan
-
 Palestine
-
 Panama
-
 Papua New Guinea
-
 Paraguay
-
 Peru
Peru
-
 Philippines
-
 Poland
-
 Portugal
-
 Puerto Rico
-
 Qatar
Qatar
-
 Reunion
-
 Romania
-
 Rwanda
-
 Saudi Arabia
-
 Serbia
-
 Singapore
-
 Slovakia
-
 Slovenia
-
 Somalia
-
 South Africa
-
 Spain
Spain
-
 Sri Lanka
-
 Sweden
-
 Switzerland
-
 Syria
Syria
-
 Taiwan
-
 Tajikistan
-
 Tanzania
-
 Thailand
-
 Trinidad and Tobago
-
 Tunisia
-
 Turkey
-
 UAE
UAE
-
 Uganda
-
 Ukraine
-
 United Kingdom
-
United States
-
 Uruguay
-
 Uzbekistan
-
 Venezuela
-
 Vietnam
-
 Yemen
Yemen
-
 Zambia
-
 Zimbabwe
- Forex
- Crypto
