
XRP price prediction: Can $1.41 support hold? XRP trades sideways

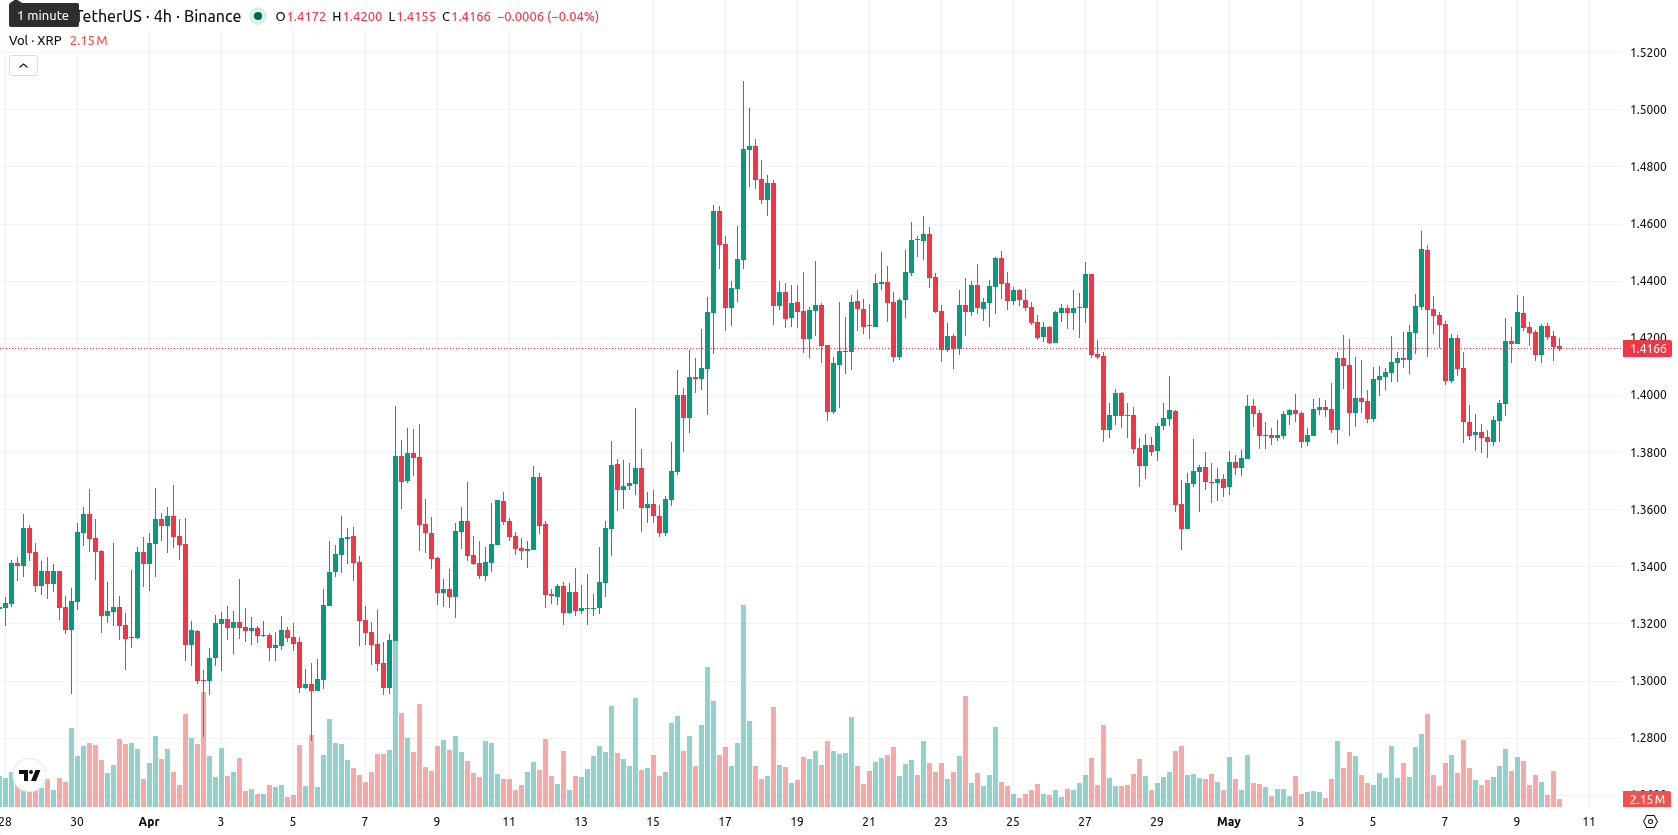
XRP (XRP) is trading at $1.418, down 0.57% for the day. The price is above its short- and medium-term moving averages but remains below its long-term average.
Highlights
- XRP Ledger upgrades target institutional use with new compliance features, permissioned exchanges, and improved settlement infrastructure to attract regulated capital inflows.
- The SEC lawsuit resolution, leadership changes, and $28.17 million weekly investment product inflow bolster XRP's institutional and commodity tokenization positioning despite ongoing sell pressure.
- Technicals indicate sideways trading between $1.38 and $1.46, with mixed momentum and a higher probability of further price weakness absent a breakout above resistance.
Regulatory advances and leadership overhaul amid sustained selling pressure
On May 9, 2026, upgrades to the XRP Ledger were reported, incorporating compliance tools, permissioned decentralized exchanges, and expanded settlement infrastructure aimed at institutional adoption and facilitating regulated capital inflows. The announcement of a new executive team with Brett Mollin as Executive Director marked a step toward consolidating leadership across strategy, engineering, and partnerships. Additionally, the conclusion of the SEC lawsuit, XRP's increased share in the tokenized commodities sector, and a notable $28.17 million weekly inflow to XRP investment products accompanied these developments, though price action has remained under broader selling pressure.
Sideways momentum as resistance holds and trend strength weakens
The SMA-20 is at $1.4077, and the SMA-50 is at $1.3831, with both levels sitting below the current price, while the SMA-200 at $1.7638 remains far above. Immediate resistance is defined by the Ichimoku Kijun at $1.4279. On the indicator side, the daily MACD signal is bullish, but the ADX registers a low reading of 9.2, suggesting a lack of clear trend strength. The RSI stands at 54.3 and the CCI is just under 50, both indicating mild buy momentum, while the Stoch RSI is overbought at 83 and BBP stays positive, giving intraday buyers a slight edge. The Awesome Oscillator shows a neutral signal. Today’s trading range spans $1.4119 – $1.4225, with subdued volatility and largely sideways price actions after the open.
Downside risk dominates as breakout lacks technical confirmation
Over the next five sessions, the expected price band is $1.38 – $1.46, which falls within the typical volatility for XRP. Probability of a sustained price increase is under 20%, as weekly technical indicators point to continued downside risk. Baseline scenario is for XRP to remain rangebound inside the $1.38 to $1.46 channel. A confirmed bullish scenario would require a breakout above the $1.43 – $1.46 resistance zone, while a drop below $1.41 would set up further weakness if broad market pressure persists.
Earlier, analysts noted that the resolution of key regulatory challenges and increased institutional activity positioned XRP for greater legitimacy, though they cautioned that technical headwinds could limit immediate upside. With the latest technical signals showing muted trend strength despite structural upgrades and new investment inflows, traders should monitor for a decisive move outside the $1.38–$1.46 range as an early indicator of directional momentum.


-
 Afghanistan
-
 Albania
-
 Algeria
-
 Angola
-
 Argentina
-
 Armenia
-
 Australia
-
 Austria
-
 Azerbaijan
-
 Bahamas
-
 Bahrain
-
 Bangladesh
-
 Belarus
-
 Belgium
-
 Bolivia
-
 Botswana
-
 Brazil
-
 Brunei
-
 Bulgaria
-
 Cambodia
-
 Cameroon
-
 Canada
-
 Chile
Chile
-
 China
China
-
 Colombia
-
 Congo
Congo
-
 Costa Rica
-
 Cote d'Ivoire
-
 Croatia
-
 Cuba
Cuba
-
 Cyprus
-
 Czechia
-
 DR Congo
-
 Denmark
-
 Dominican Republic
-
 Ecuador
-
 Egypt
Egypt
-
 El Salvador
-
 Estonia
-
 Eswatini
-
 Ethiopia
-
 Finland
-
 France
-
 Georgia
-
 Germany
-
 Ghana
Ghana
-
 Greece
-
 Haiti
Haiti
-
 Hong Kong
-
 Hungary
-
 India
India
-
 Indonesia
-
 Iran, Islamic republic
-
 Iraq
Iraq
-
 Ireland
-
 Israel
-
 Italy
Italy
-
 Jamaica
-
 Japan
Japan
-
 Jordan
-
 Kazakhstan
-
 Kenya
Kenya
-
 Korea
Korea
-
 Kuwait
-
 Kyrgyzstan
-
 Laos
Laos
-
 Latvia
-
 Lebanon
-
 Lesotho
-
 Libya
Libya
-
 Lithuania
-
 Luxembourg
-
 Madagascar
-
 Malaysia
-
 Malta
Malta
-
 Mauritius
-
 Mexico
-
 Moldova
-
 Mongolia
-
 Montenegro
-
 Morocco
-
 Mozambique
-
 Myanmar
-
 Namibia
-
 Nepal
Nepal
-
 Netherlands
-
 New Zealand
-
 Nigeria
-
 North Macedonia
-
 Norway
-
 Oman
Oman
-
 Pakistan
-
 Palestine
-
 Panama
-
 Papua New Guinea
-
 Paraguay
-
 Peru
Peru
-
 Philippines
-
 Poland
-
 Portugal
-
 Puerto Rico
-
 Qatar
Qatar
-
 Reunion
-
 Romania
-
 Rwanda
-
 Saudi Arabia
-
 Serbia
-
 Singapore
-
 Slovakia
-
 Slovenia
-
 Somalia
-
 South Africa
-
 Spain
Spain
-
 Sri Lanka
-
 Sweden
-
 Switzerland
-
 Syria
Syria
-
 Taiwan
-
 Tajikistan
-
 Tanzania
-
 Thailand
-
 Trinidad and Tobago
-
 Tunisia
-
 Turkey
-
 UAE
UAE
-
 Uganda
-
 Ukraine
-
 United Kingdom
-
United States
-
 Uruguay
-
 Uzbekistan
-
 Venezuela
-
 Vietnam
-
 Yemen
Yemen
-
 Zambia
-
 Zimbabwe
- Forex
- Crypto
