
Bitcoin price prediction: $78,300 support in focus as BTC trades flat

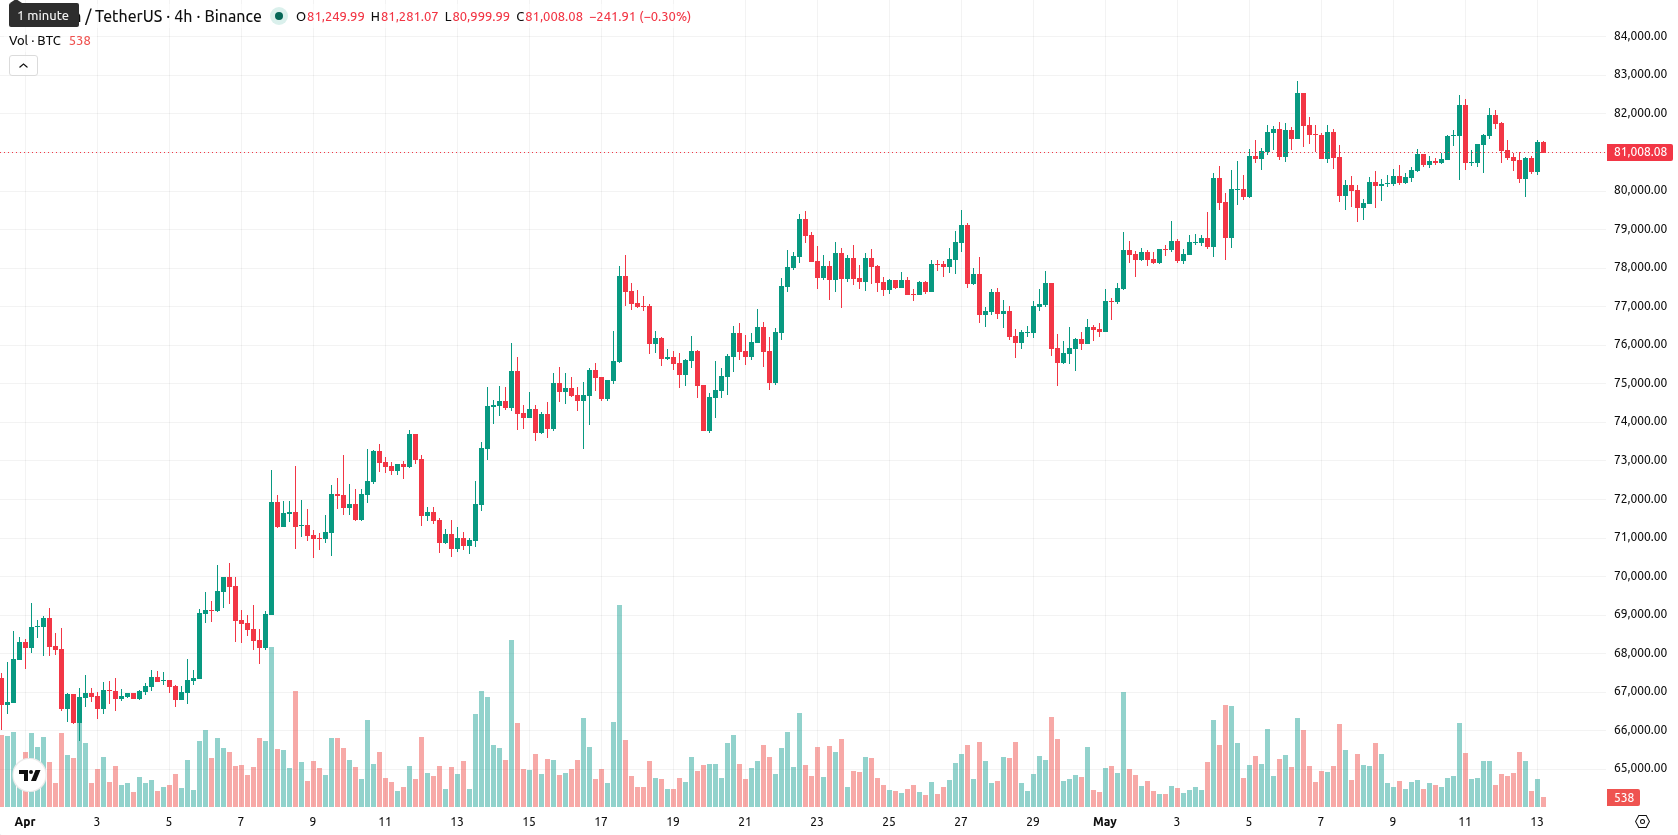
Bitcoin (BTC) is trading at $81,019.99, down 0.25% for the session. The current price sits above key short- and medium-term moving averages, while remaining below levels that define the longer-term trend.
Highlights
- US spot Bitcoin ETFs saw renewed inflows, indicating rising institutional demand through regulated exchange-traded products.
- Strategy increased its Bitcoin reserve to 818,869 BTC but reported a $12.54 billion Q1 2026 net loss and flagged possible token sales for dividends.
- Short- and medium-term technical signals are bullish, but Bitcoin faces long-term resistance, with a likely trading range of $77,000–$85,000 and near-term downside risk.
Institutional inflows and regulatory moves as selling pressure persists
Spot Bitcoin ETFs in the US recorded new inflows, providing increased institutional demand via regulated products. Meanwhile, Strategy added 535 BTC to its treasury reserves, raising its total holdings to 818,869 BTC; at the same time, the company reported a $12.54 billion net loss in Q1 2026 and indicated that small amounts of Bitcoin may be sold to fund dividend obligations. In regulatory developments, the Senate Banking Committee released the text of the CLARITY Act, which, if passed, could establish clearer legal status for Bitcoin within exchange-traded products, though price action has remained under broader selling pressure.
Divergent momentum signals amid resistance at major long-term average
BTC is currently trading between specific technical reference points: above the 20-day ($79,048.71) and 50-day ($74,393.94) simple moving averages, but still below the 200-day level at $82,460.99. The Ichimoku Kijun line at $78,287.16 now serves as immediate support. On the momentum side, MACD (Strong Buy) and ADX (Buy) indicate bullish undercurrents, while RSI and CCI both reflect ongoing buying activity without entering overbought territory. The Stoch RSI is neutral and Bull/Bear Power (BBP) indicates overbought conditions, while the Awesome Oscillator offers no clear directional signal. A divergence among oscillators and momentum readings suggests near-term uncertainty and possible price consolidation.
Sideways-to-down bias favored as breakout odds remain low
Over the coming five sessions, Bitcoin is likely to trade within a typical volatility band of $77,000 to $85,000 relative to current levels. The short-term probability of an upward breakout is below 20%, with a sideways or downward scenario favored. A clearance above $82,500 would signal room to target $85,000, while a move below the Kijun support at $78,300 could expose the $77,000 area.
Earlier, analysts noted that Bitcoin entered recent inflation data releases with caution, with risk assets showing sensitivity to changing rate expectations and broader macroeconomic signals. The emergence of institutional inflows into US spot ETFs and complex regulatory developments now add a new dimension, making the $82,500 level a key threshold to monitor for potential upside momentum amid diverging technical signals.


Latest Bitcoin News


-
 Afghanistan
-
 Albania
-
 Algeria
-
 Angola
-
 Argentina
-
 Armenia
-
 Australia
-
 Austria
-
 Azerbaijan
-
 Bahamas
-
 Bahrain
-
 Bangladesh
-
 Belarus
-
 Belgium
-
 Bolivia
-
 Botswana
-
 Brazil
-
 Brunei
-
 Bulgaria
-
 Cambodia
-
 Cameroon
-
 Canada
-
 Chile
Chile
-
 China
China
-
 Colombia
-
 Congo
Congo
-
 Costa Rica
-
 Cote d'Ivoire
-
 Croatia
-
 Cuba
Cuba
-
 Cyprus
-
 Czechia
-
 DR Congo
-
 Denmark
-
 Dominican Republic
-
 Ecuador
-
 Egypt
Egypt
-
 El Salvador
-
 Estonia
-
 Eswatini
-
 Ethiopia
-
 Finland
-
 France
-
 Georgia
-
 Germany
-
 Ghana
Ghana
-
 Greece
-
 Haiti
Haiti
-
 Hong Kong
-
 Hungary
-
 India
India
-
 Indonesia
-
 Iran, Islamic republic
-
 Iraq
Iraq
-
 Ireland
-
 Israel
-
 Italy
Italy
-
 Jamaica
-
 Japan
Japan
-
 Jordan
-
 Kazakhstan
-
 Kenya
Kenya
-
 Korea
Korea
-
 Kuwait
-
 Kyrgyzstan
-
 Laos
Laos
-
 Latvia
-
 Lebanon
-
 Lesotho
-
 Libya
Libya
-
 Lithuania
-
 Luxembourg
-
 Madagascar
-
 Malaysia
-
 Malta
Malta
-
 Mauritius
-
 Mexico
-
 Moldova
-
 Mongolia
-
 Montenegro
-
 Morocco
-
 Mozambique
-
 Myanmar
-
 Namibia
-
 Nepal
Nepal
-
 Netherlands
-
 New Zealand
-
 Nigeria
-
 North Macedonia
-
 Norway
-
 Oman
Oman
-
 Pakistan
-
 Palestine
-
 Panama
-
 Papua New Guinea
-
 Paraguay
-
 Peru
Peru
-
 Philippines
-
 Poland
-
 Portugal
-
 Puerto Rico
-
 Qatar
Qatar
-
 Reunion
-
 Romania
-
 Rwanda
-
 Saudi Arabia
-
 Serbia
-
 Singapore
-
 Slovakia
-
 Slovenia
-
 Somalia
-
 South Africa
-
 Spain
Spain
-
 Sri Lanka
-
 Sweden
-
 Switzerland
-
 Syria
Syria
-
 Taiwan
-
 Tajikistan
-
 Tanzania
-
 Thailand
-
 Trinidad and Tobago
-
 Tunisia
-
 Turkey
-
 UAE
UAE
-
 Uganda
-
 Ukraine
-
 United Kingdom
-
United States
-
 Uruguay
-
 Uzbekistan
-
 Venezuela
-
 Vietnam
-
 Yemen
Yemen
-
 Zambia
-
 Zimbabwe
- Forex
- Crypto
