
+7.01% for Celestia as momentum slows after recent climb

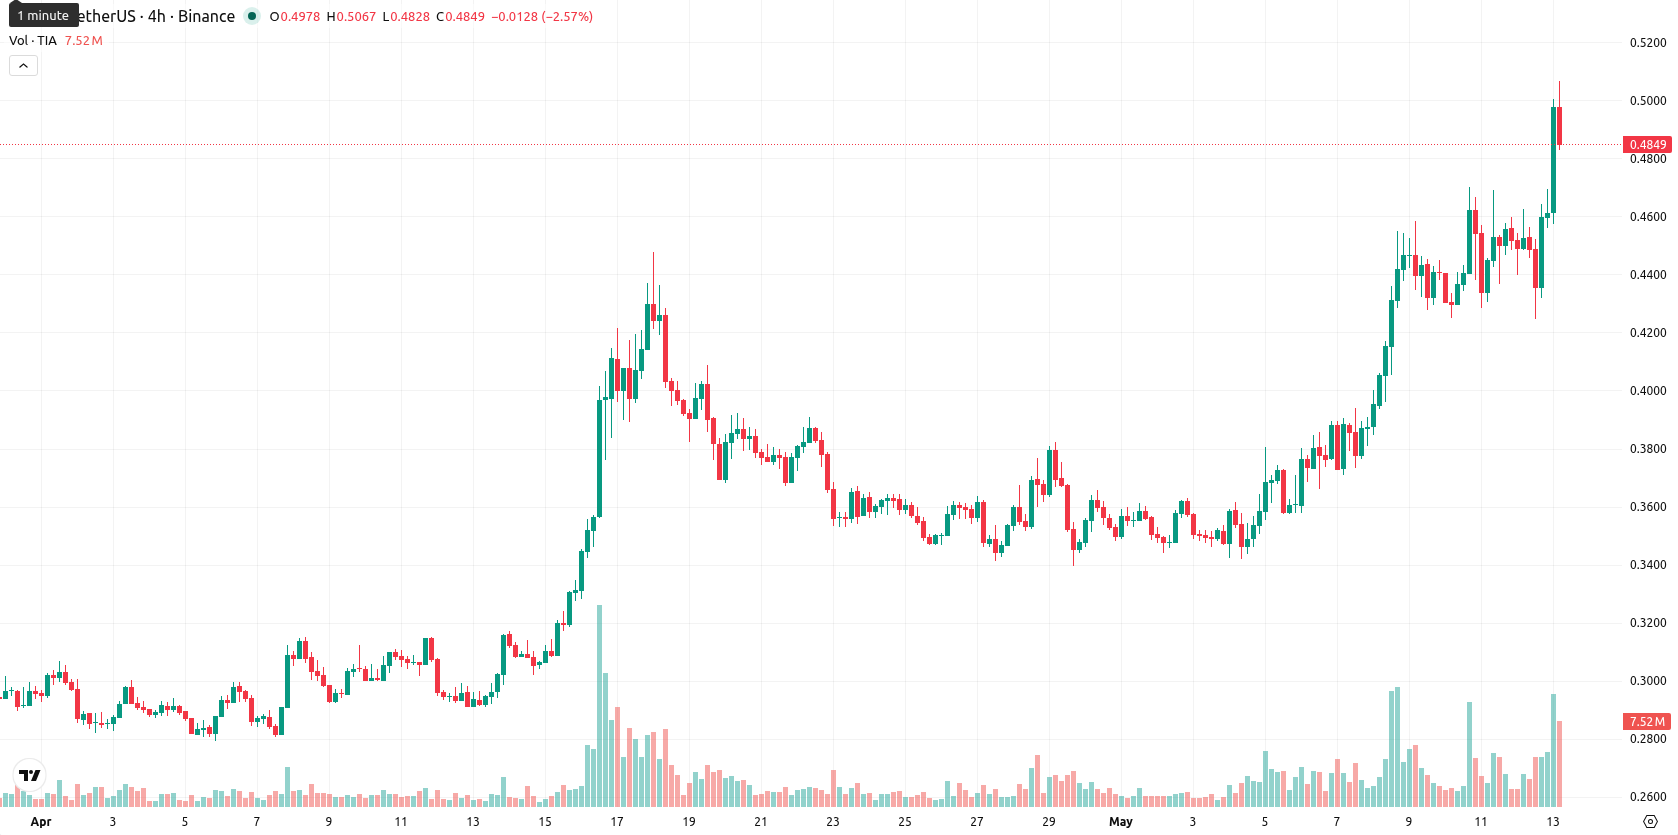
Celestia (TIA) is trading at $0.4888 after a 7.01% gain today, placing the price well above its short- and medium-term moving averages and just above its pivotal long-term average.
Highlights
- TIA maintains a strong short- and medium-term bullish trend, trading well above key moving averages.
- Despite bullish momentum, multiple indicators are in overbought territory, raising caution for potential near-term exhaustion.
- Expected five-day range is $0.49–$0.59, with probability skewed toward a sideways or bearish move barring a breakout above resistance.
Bullish momentum persists as overbought signals prompt caution
For TIA, the current price of $0.4888 sits above the SMA-20 at $0.3824 and SMA-50 at $0.3467, and just above the SMA-200 at $0.4873. The Ichimoku Kijun level (D1) is at $0.4048, acting as the nearest support. Intraday resistance is observed at today’s high of $0.5046, while support is clustered near $0.4873 (SMA-200) and $0.4048 (Ichimoku Kijun). D1 momentum indicators remain strongly bullish: the ADX and MACD provide trend confirmation, while the RSI is elevated at 73.46, CCI marks overbought, and Stoch RSI is pinned at 100. BBP remains positive, indicating buyers control the session, and the AO reflects ongoing upward momentum. Despite strong readings, overbought signals and some divergence suggest caution for near-term entries.
Retracement risk rises as upside breakout remains unlikely
Over the next five trading days, TIA is expected to fluctuate within a $0.49–$0.59 volatility band relative to current levels. The probability of a sustained move above $0.59 is low (less than 20%), making a downward move more likely based on weekly technical signals. The base case scenario sees TIA consolidating between $0.49 and $0.59, with a bullish break requiring a close above $0.59. A drop below $0.49 could trigger deeper retracement toward the Ichimoku Kijun and short-term averages.
Earlier, analysts noted that Celestia was demonstrating short-term bullish momentum but remained constrained by broad consolidation and the risk of corrective moves. The current technical setup confirms a continued bullish bias for now, but with multiple overbought signals and divergence emerging, traders should watch for a potential downside move if TIA falls back below its SMA-200.


Latest Celestia News


-
 Afghanistan
-
 Albania
-
 Algeria
-
 Angola
-
 Argentina
-
 Armenia
-
 Australia
-
 Austria
-
 Azerbaijan
-
 Bahamas
-
 Bahrain
-
 Bangladesh
-
 Belarus
-
 Belgium
-
 Bolivia
-
 Botswana
-
 Brazil
-
 Brunei
-
 Bulgaria
-
 Cambodia
-
 Cameroon
-
 Canada
-
 Chile
Chile
-
 China
China
-
 Colombia
-
 Congo
Congo
-
 Costa Rica
-
 Cote d'Ivoire
-
 Croatia
-
 Cuba
Cuba
-
 Cyprus
-
 Czechia
-
 DR Congo
-
 Denmark
-
 Dominican Republic
-
 Ecuador
-
 Egypt
Egypt
-
 El Salvador
-
 Estonia
-
 Eswatini
-
 Ethiopia
-
 Finland
-
 France
-
 Georgia
-
 Germany
-
 Ghana
Ghana
-
 Greece
-
 Haiti
Haiti
-
 Hong Kong
-
 Hungary
-
 India
India
-
 Indonesia
-
 Iran, Islamic republic
-
 Iraq
Iraq
-
 Ireland
-
 Israel
-
 Italy
Italy
-
 Jamaica
-
 Japan
Japan
-
 Jordan
-
 Kazakhstan
-
 Kenya
Kenya
-
 Korea
Korea
-
 Kuwait
-
 Kyrgyzstan
-
 Laos
Laos
-
 Latvia
-
 Lebanon
-
 Lesotho
-
 Libya
Libya
-
 Lithuania
-
 Luxembourg
-
 Madagascar
-
 Malaysia
-
 Malta
Malta
-
 Mauritius
-
 Mexico
-
 Moldova
-
 Mongolia
-
 Montenegro
-
 Morocco
-
 Mozambique
-
 Myanmar
-
 Namibia
-
 Nepal
Nepal
-
 Netherlands
-
 New Zealand
-
 Nigeria
-
 North Macedonia
-
 Norway
-
 Oman
Oman
-
 Pakistan
-
 Palestine
-
 Panama
-
 Papua New Guinea
-
 Paraguay
-
 Peru
Peru
-
 Philippines
-
 Poland
-
 Portugal
-
 Puerto Rico
-
 Qatar
Qatar
-
 Reunion
-
 Romania
-
 Rwanda
-
 Saudi Arabia
-
 Serbia
-
 Singapore
-
 Slovakia
-
 Slovenia
-
 Somalia
-
 South Africa
-
 Spain
Spain
-
 Sri Lanka
-
 Sweden
-
 Switzerland
-
 Syria
Syria
-
 Taiwan
-
 Tajikistan
-
 Tanzania
-
 Thailand
-
 Trinidad and Tobago
-
 Tunisia
-
 Turkey
-
 UAE
UAE
-
 Uganda
-
 Ukraine
-
 United Kingdom
-
United States
-
 Uruguay
-
 Uzbekistan
-
 Venezuela
-
 Vietnam
-
 Yemen
Yemen
-
 Zambia
-
 Zimbabwe
- Forex
- Crypto
