
Solana price prediction: Can $86.00 support hold as SOL drops 3.32%?

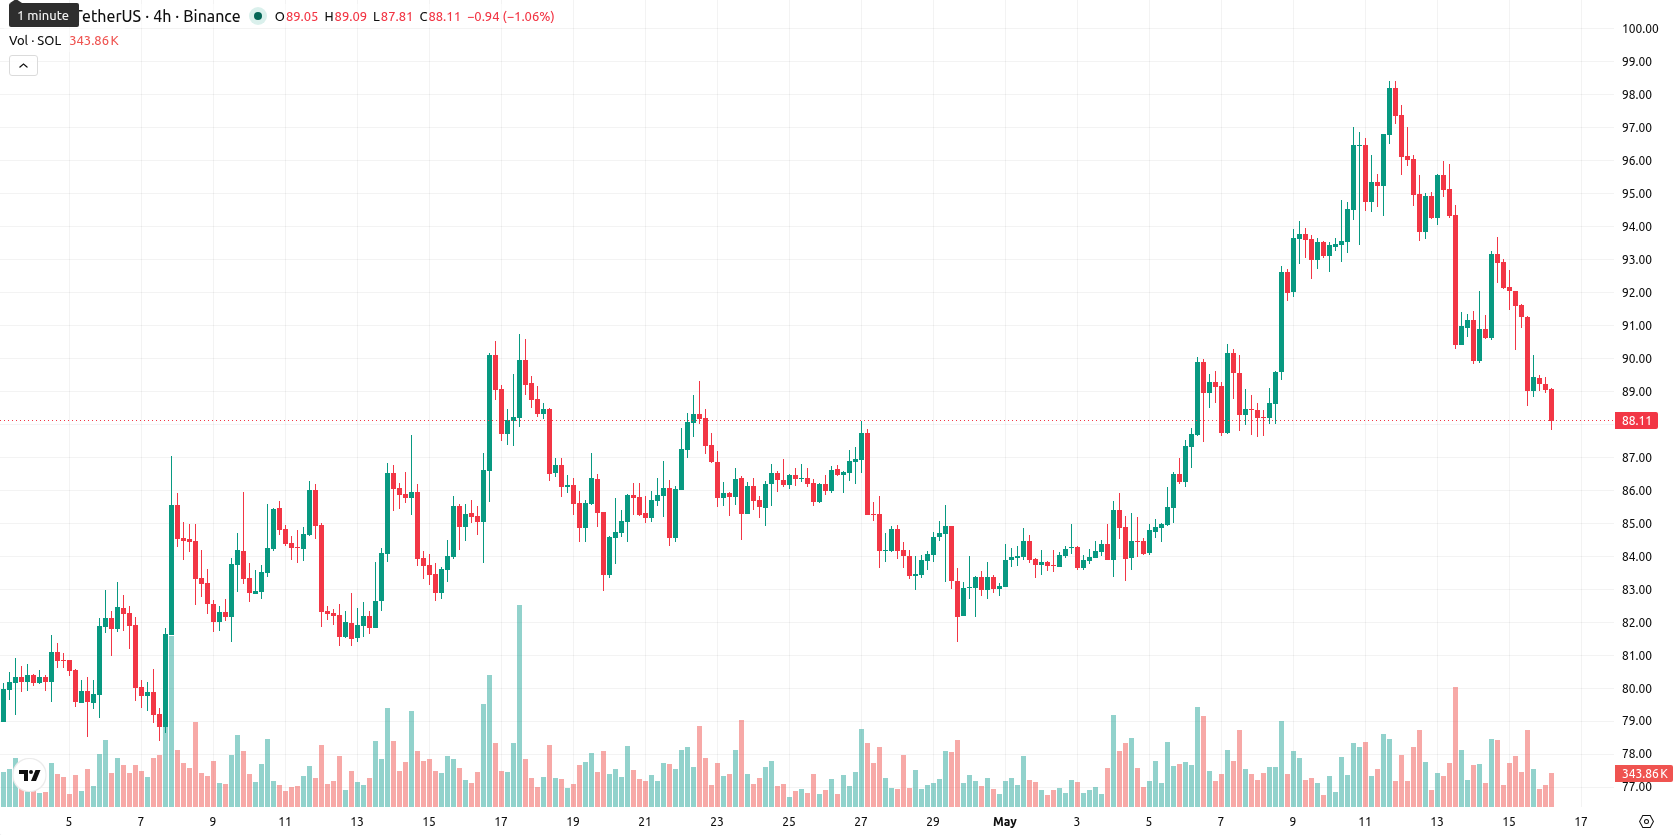
Solana (SOL) is trading at $88.03 after a daily drop of 3.32%. The current level is below its key short-term averages, indicating a cautious near-term setup with some medium-term support.
Highlights
- Forward Industries posted sharp quarterly losses after reducing the value of its Solana holdings from $124 to $83, despite a fourfold rise in SOL staking revenue to $13 million.
- Institutional adoption of Solana accelerated as total value locked in real-world assets hit a record $2.42 billion, coinciding with the mainnet activation of quantum signatures for improved technical efficiency.
- SOL exhibits ongoing downside bias, trading below key moving averages with low momentum and a likely range of $86.00 to $91.50 over the next five days.
Institutional losses and new products drive capital flows and sentiment
Forward Industries, the largest institutional holder of Solana, reported significant quarterly losses after marking down its SOL holdings from $124 to $83 by the end of March, though the company’s staking revenue rose fourfold to $13 million. On May 16, the Spiko Amundi Overnight Swap Fund launched on the Solana blockchain as total value locked in real-world assets reached a record $2.42 billion, reflecting rising institutional interest and capital on the network. Also that day, Solana activated a quantum signature scheme on its mainnet, reducing compute units to further enhance throughput and technical efficiency. These fundamental and technical developments have been accompanied by ongoing downside price action.
Divergent momentum as Solana tests tight support and resistance
SMA-20 is positioned at $88.39, acting as the nearest moving average above the current price, while SMA-50 at $85.71 offers a nearby medium-term support. The SMA-200 remains distant at $111.39, indicating substantial long-term resistance overhead. The Ichimoku Kijun level on the daily timeframe is $89.91, providing immediate resistance. Technical indicators reveal a divergent setup: MACD on the daily chart suggests mild support for potential buying, but ADX is weak at 13.41, signaling neutral momentum. RSI is neutral at 51, paired with a neutral CCI, while Stoch RSI is oversold at 14.75, suggesting short-term exhaustion after recent declines. BBP remains positive, indicating recent buyer interest, though price trades near today’s low within a tight, low-volatility session and after a small opening gap down.
Sideways outlook as volatility bands contain directional risk
For the next five days, the expected volatility band is likely to remain between $86.00 and $91.50, based on current pricing and recent price behavior. There is a low probability of a price increase, given the absence of firm support from major weekly technical indicators and moving averages. The base case scenario is for continued sideways trading within this corridor. A sustained move above $89.91 could prompt short covering and test the upper range, while a clear break below $86.00 could open the way for further downside.
Earlier, analysts noted that Ethereum maintains a commanding lead among smart contract blockchains due to its vast and geographically dispersed validator base, which underpins its security and decentralization. Solana’s recent integration of quantum signature technology and robust institutional activity signals a maturing network, but for traders, monitoring for a decisive break above $91.50 or below $86.00 may be key to identifying the next directional move.


-
 Afghanistan
-
 Albania
-
 Algeria
-
 Angola
-
 Argentina
-
 Armenia
-
 Australia
-
 Austria
-
 Azerbaijan
-
 Bahamas
-
 Bahrain
-
 Bangladesh
-
 Belarus
-
 Belgium
-
 Bolivia
-
 Botswana
-
 Brazil
-
 Brunei
-
 Bulgaria
-
 Cambodia
-
 Cameroon
-
 Canada
-
 Chile
Chile
-
 China
China
-
 Colombia
-
 Congo
Congo
-
 Costa Rica
-
 Cote d'Ivoire
-
 Croatia
-
 Cuba
Cuba
-
 Cyprus
-
 Czechia
-
 DR Congo
-
 Denmark
-
 Dominican Republic
-
 Ecuador
-
 Egypt
Egypt
-
 El Salvador
-
 Estonia
-
 Eswatini
-
 Ethiopia
-
 Finland
-
 France
-
 Georgia
-
 Germany
-
 Ghana
Ghana
-
 Greece
-
 Haiti
Haiti
-
 Hong Kong
-
 Hungary
-
 India
India
-
 Indonesia
-
 Iran, Islamic republic
-
 Iraq
Iraq
-
 Ireland
-
 Israel
-
 Italy
Italy
-
 Jamaica
-
 Japan
Japan
-
 Jordan
-
 Kazakhstan
-
 Kenya
Kenya
-
 Korea
Korea
-
 Kuwait
-
 Kyrgyzstan
-
 Laos
Laos
-
 Latvia
-
 Lebanon
-
 Lesotho
-
 Libya
Libya
-
 Lithuania
-
 Luxembourg
-
 Madagascar
-
 Malaysia
-
 Malta
Malta
-
 Mauritius
-
 Mexico
-
 Moldova
-
 Mongolia
-
 Montenegro
-
 Morocco
-
 Mozambique
-
 Myanmar
-
 Namibia
-
 Nepal
Nepal
-
 Netherlands
-
 New Zealand
-
 Nigeria
-
 North Macedonia
-
 Norway
-
 Oman
Oman
-
 Pakistan
-
 Palestine
-
 Panama
-
 Papua New Guinea
-
 Paraguay
-
 Peru
Peru
-
 Philippines
-
 Poland
-
 Portugal
-
 Puerto Rico
-
 Qatar
Qatar
-
 Reunion
-
 Romania
-
 Rwanda
-
 Saudi Arabia
-
 Serbia
-
 Singapore
-
 Slovakia
-
 Slovenia
-
 Somalia
-
 South Africa
-
 Spain
Spain
-
 Sri Lanka
-
 Sweden
-
 Switzerland
-
 Syria
Syria
-
 Taiwan
-
 Tajikistan
-
 Tanzania
-
 Thailand
-
 Trinidad and Tobago
-
 Tunisia
-
 Turkey
-
 UAE
UAE
-
 Uganda
-
 Ukraine
-
 United Kingdom
-
United States
-
 Uruguay
-
 Uzbekistan
-
 Venezuela
-
 Vietnam
-
 Yemen
Yemen
-
 Zambia
-
 Zimbabwe
- Forex
- Crypto
