
Solana price prediction: $89.91 resistance in focus? SOL trades flat

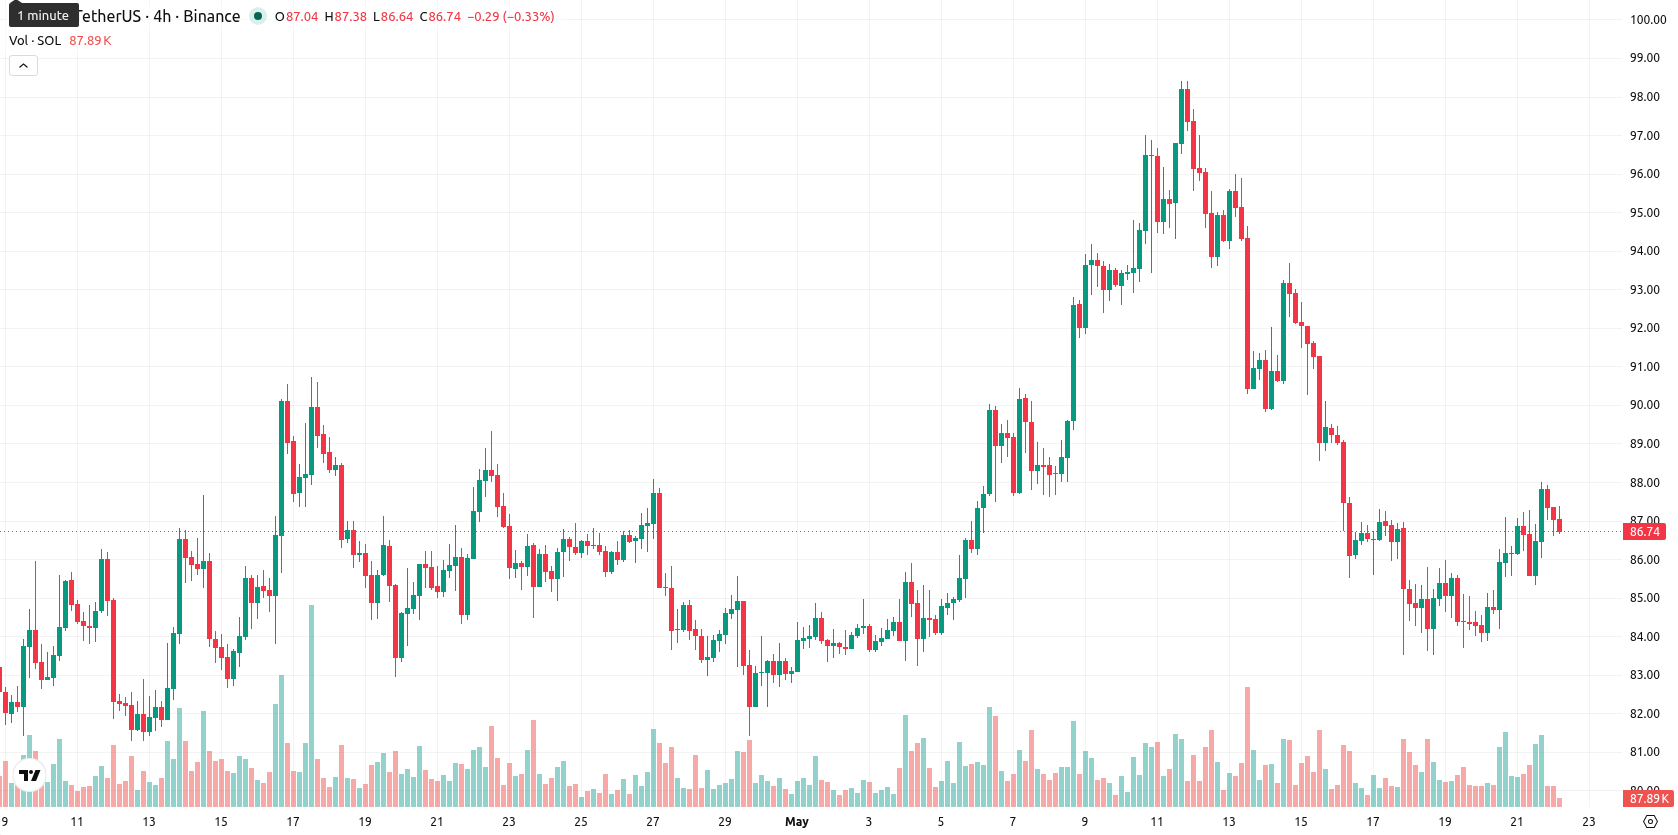
Solana (SOL) is trading at $86.78 today, up 0.49% on the session and showing limited gains. The price currently sits below its key short-term moving averages, with muted momentum after the open.
Highlights
- Senate progress on the CLARITY Act enhances Solana's regulatory clarity, boosting confidence in the network's legal future prospects.
- Morgan Stanley's MSOL ETF update to include direct staking and $5.84 million spot ETF inflows reflect rising institutional demand for SOL.
- SOL remains below key technical resistance, with indicators signaling weakness and an expected five-day trading range between $85.54 and $88.89.
Legal reforms and ETF inflows drive robust institutional interest
Regulatory momentum for Solana is building as the CLARITY Act moved to a full Senate vote on May 21, 2026, introducing new protections for developers and shaping DeFi policy. This advancement boosts confidence in the network's long-term legal standing and could drive further institutional and developer engagement. Meanwhile, Morgan Stanley updated its MSOL ETF filing to include direct staking, expanding regulated access to SOL, and recent spot ETF inflows totaling $5.84 million signal robust institutional interest. Additionally, Solana's network reported approximately 10.1 billion transactions and $89.5 million in Q1 revenue, underscoring strong underlying usage.
Resistance limits upside as mixed indicators signal persistent weakness
On the technical front, SOL sits just under the SMA-20 at $88.84 and the Ichimoku Kijun resistance at $89.91, with short-term stabilization seen near the SMA-50 at $86.13. The long-term trend remains bearish as price trades well below the SMA-200 at $108.29. Key momentum indicators are mixed: the MACD and ADX show neutrality on the daily chart, while RSI is just below 50 with a 'Sell' signal, and the Stoch RSI and CCI remain neutral. Bull/Bear Power (BBP) flags oversold conditions, and the Awesome Oscillator points to prevailing downside pressure. Today’s session opened with a small gap up, and price is oscillating between $86.68 and $87.35, reflecting low volatility and a lack of clear short-term direction.
Range-bound price outlook as breakout probability remains low
Looking ahead to the next five trading days, SOL is likely to remain range-bound between $85.54 and $88.89, with tightening intraday volatility defining a typical band relative to current levels. The probability of a significant price breakout to the upside is assessed at less than 20%, with sideways price action below resistance most likely. A bullish scenario would require a decisive move above the $89.91 Kijun level to open up the upper range, while a drop below $85.54 could result in renewed selling and a test of deeper support.
Earlier, analysts noted that Solana was locked in a range-bound pattern with neutral technical momentum and evolving institutional dynamics. This outlook is further supported by current price action and market structure, making a sustained move above the $89.91 resistance level the key signal for any upcoming shift in trend.


-
 Afghanistan
-
 Albania
-
 Algeria
-
 Angola
-
 Argentina
-
 Armenia
-
 Australia
-
 Austria
-
 Azerbaijan
-
 Bahamas
-
 Bahrain
-
 Bangladesh
-
 Belarus
-
 Belgium
-
 Bolivia
-
 Botswana
-
 Brazil
-
 Brunei
-
 Bulgaria
-
 Cambodia
-
 Cameroon
-
 Canada
-
 Chile
Chile
-
 China
China
-
 Colombia
-
 Congo
Congo
-
 Costa Rica
-
 Cote d'Ivoire
-
 Croatia
-
 Cuba
Cuba
-
 Cyprus
-
 Czechia
-
 DR Congo
-
 Denmark
-
 Dominican Republic
-
 Ecuador
-
 Egypt
Egypt
-
 El Salvador
-
 Estonia
-
 Eswatini
-
 Ethiopia
-
 Finland
-
 France
-
 Georgia
-
 Germany
-
 Ghana
Ghana
-
 Greece
-
 Haiti
Haiti
-
 Hong Kong
-
 Hungary
-
 India
India
-
 Indonesia
-
 Iran, Islamic republic
-
 Iraq
Iraq
-
 Ireland
-
 Israel
-
 Italy
Italy
-
 Jamaica
-
 Japan
Japan
-
 Jordan
-
 Kazakhstan
-
 Kenya
Kenya
-
 Korea
Korea
-
 Kuwait
-
 Kyrgyzstan
-
 Laos
Laos
-
 Latvia
-
 Lebanon
-
 Lesotho
-
 Libya
Libya
-
 Lithuania
-
 Luxembourg
-
 Madagascar
-
 Malaysia
-
 Malta
Malta
-
 Mauritius
-
 Mexico
-
 Moldova
-
 Mongolia
-
 Montenegro
-
 Morocco
-
 Mozambique
-
 Myanmar
-
 Namibia
-
 Nepal
Nepal
-
 Netherlands
-
 New Zealand
-
 Nigeria
-
 North Macedonia
-
 Norway
-
 Oman
Oman
-
 Pakistan
-
 Palestine
-
 Panama
-
 Papua New Guinea
-
 Paraguay
-
 Peru
Peru
-
 Philippines
-
 Poland
-
 Portugal
-
 Puerto Rico
-
 Qatar
Qatar
-
 Reunion
-
 Romania
-
 Rwanda
-
 Saudi Arabia
-
 Serbia
-
 Singapore
-
 Slovakia
-
 Slovenia
-
 Somalia
-
 South Africa
-
 Spain
Spain
-
 Sri Lanka
-
 Sweden
-
 Switzerland
-
 Syria
Syria
-
 Taiwan
-
 Tajikistan
-
 Tanzania
-
 Thailand
-
 Trinidad and Tobago
-
 Tunisia
-
 Turkey
-
 UAE
UAE
-
 Uganda
-
 Ukraine
-
 United Kingdom
-
United States
-
 Uruguay
-
 Uzbekistan
-
 Venezuela
-
 Vietnam
-
 Yemen
Yemen
-
 Zambia
-
 Zimbabwe
- Forex
- Crypto
