
Bitcoin price prediction: $78,600 resistance in focus as BTC advances 1.77%

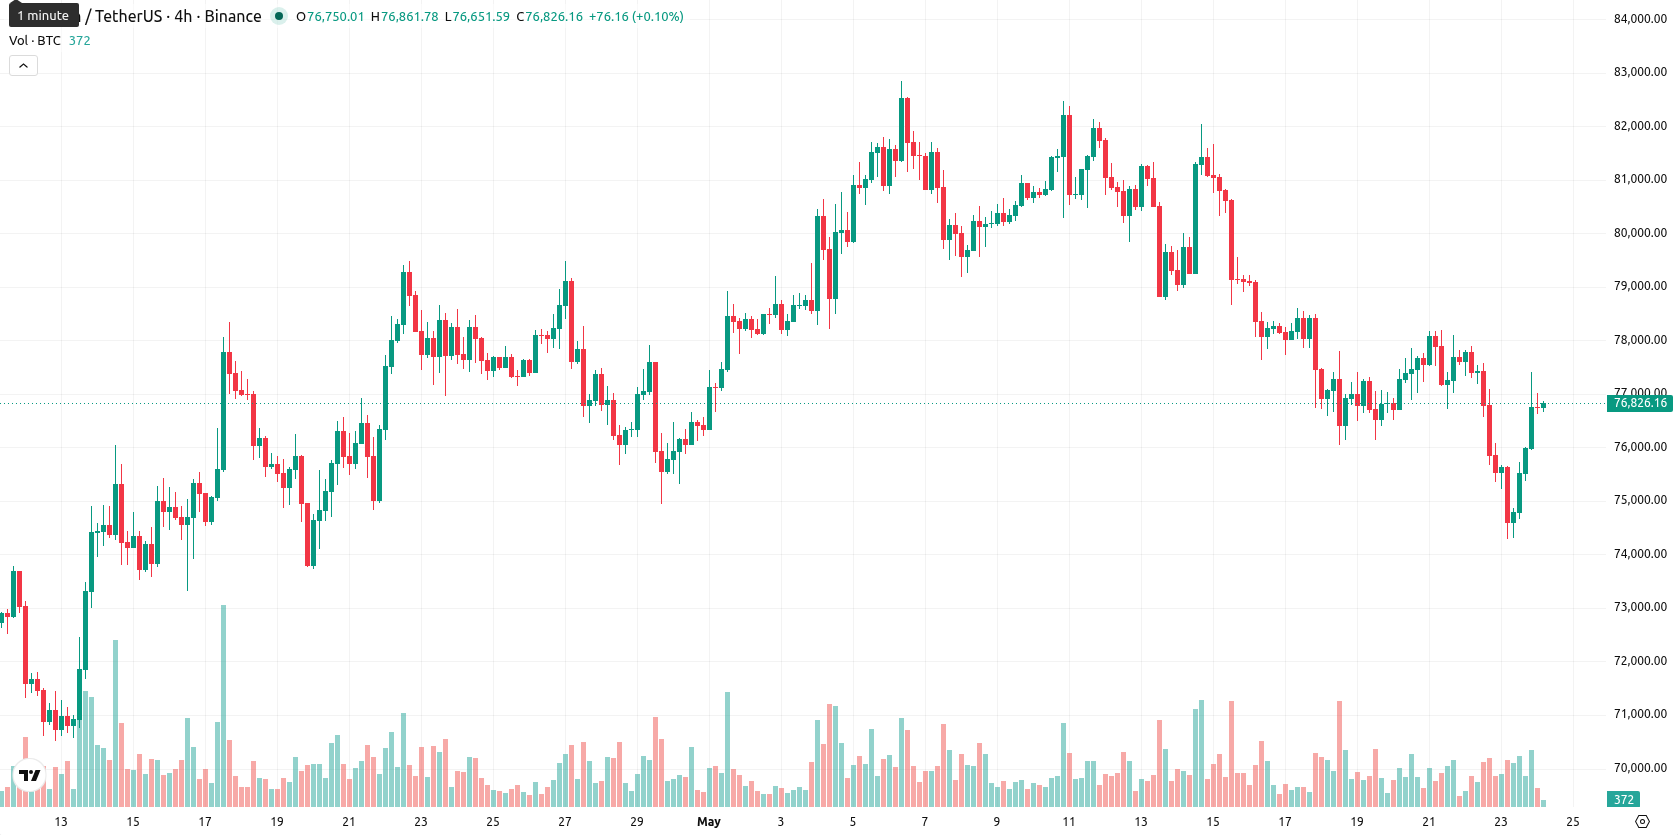
Bitcoin (BTC) is trading at $76,822.23, rising 1.77% from the previous close. The price currently sits below its key short- and long-term moving averages but remains marginally above its medium-term average.
Highlights
- U.S. spot Bitcoin ETFs saw net outflows of $1.26 billion between May 15 and May 22, reflecting near-term institutional pullback.
- BlackRock's IBIT remains the top ETF with $61.1 billion in assets amid selective rotation, as Bank of America increases Bitcoin ETF exposure and pares back Ethereum and Solana holdings.
- Bitcoin faces selling pressure, holding below key moving averages; forecasts point to a likely consolidation between $75,000 and $78,500 over the next week.
Institutional positioning shifts as ETF outflows pressure sentiment
U.S. spot Bitcoin ETFs registered substantial net outflows totaling approximately $1.26 billion over six trading sessions from May 15 to May 22, indicating a significant reduction in institutional liquidity and dampening near-term demand for Bitcoin. Despite these outflows, BlackRock’s iShares Bitcoin Trust remains the dominant ETF with $61.1 billion in net assets, suggesting continued institutional preference for Bitcoin exposure even as overall ETF assets under management dropped below $100 billion. Bank of America’s recent regulatory filing showed a targeted increase in its stake in the IBIT Bitcoin ETF alongside reduced exposure to Ethereum and Solana products, reflecting selective rotation among major cryptocurrencies. A newly introduced bill in the U.S. House that would restrict government-held Bitcoin sales for twenty years underscores ongoing regulatory initiatives affecting the asset’s long-term supply dynamics.
Momentum mixed as resistance looms above oversold signals
BTC is currently positioned just above the 50-day SMA at $76,587.64, while trading below both the 20-day SMA at $79,196.28 and the long-term 200-day SMA at $80,692.85. The Ichimoku Kijun on the daily chart stands at $78,598.70, presenting near-term resistance, while support is anchored just under current prices at the 50-day SMA. Momentum indicators present a mixed outlook: the MACD is neutral to slightly negative and the ADX also signals a neutral trend at low levels. The D1 RSI and CCI both register mild oversold conditions, while Stoch RSI and BBP indicate selling dominance. The Awesome Oscillator remains negative, in line with prevailing downward bias, but a bullish shift in the daily HMA points to short-term upside potential.
Downside bias persists as range-bound outlook dominates
For the next five trading days, price action is expected to remain within a typical volatility band of $75,000 to $78,500, based on current momentum and the normalized weekly forecast. While the probability of a sustained move higher remains below 20%, with only the weekly 200-day MA providing a bullish read, most weekly momentum indicators suggest a bias toward further downside. The baseline scenario points to range-bound consolidation between immediate support and resistance, with any breakout above $78,600 opening the door to a bullish scenario, while a fall below $75,000 would heighten the risk of accelerated selling.
Earlier, analysts noted that a combination of regulatory pressure and weak technical momentum was keeping Bitcoin under broad selling pressure amid loss of retail access points and cautious sentiment. The current article reinforces this bearish overhang by highlighting ongoing institutional outflows and mixed momentum signals, with traders advised to watch for a decisive move above $78,600 or below $75,000 to determine the next directional break.


Latest Bitcoin News


-
 Afghanistan
-
 Albania
-
 Algeria
-
 Angola
-
 Argentina
-
 Armenia
-
 Australia
-
 Austria
-
 Azerbaijan
-
 Bahamas
-
 Bahrain
-
 Bangladesh
-
 Belarus
-
 Belgium
-
 Bolivia
-
 Botswana
-
 Brazil
-
 Brunei
-
 Bulgaria
-
 Cambodia
-
 Cameroon
-
 Canada
-
 Chile
Chile
-
 China
China
-
 Colombia
-
 Congo
Congo
-
 Costa Rica
-
 Cote d'Ivoire
-
 Croatia
-
 Cuba
Cuba
-
 Cyprus
-
 Czechia
-
 DR Congo
-
 Denmark
-
 Dominican Republic
-
 Ecuador
-
 Egypt
Egypt
-
 El Salvador
-
 Estonia
-
 Eswatini
-
 Ethiopia
-
 Finland
-
 France
-
 Georgia
-
 Germany
-
 Ghana
Ghana
-
 Greece
-
 Haiti
Haiti
-
 Hong Kong
-
 Hungary
-
 India
India
-
 Indonesia
-
 Iran, Islamic republic
-
 Iraq
Iraq
-
 Ireland
-
 Israel
-
 Italy
Italy
-
 Jamaica
-
 Japan
Japan
-
 Jordan
-
 Kazakhstan
-
 Kenya
Kenya
-
 Korea
Korea
-
 Kuwait
-
 Kyrgyzstan
-
 Laos
Laos
-
 Latvia
-
 Lebanon
-
 Lesotho
-
 Libya
Libya
-
 Lithuania
-
 Luxembourg
-
 Madagascar
-
 Malaysia
-
 Malta
Malta
-
 Mauritius
-
 Mexico
-
 Moldova
-
 Mongolia
-
 Montenegro
-
 Morocco
-
 Mozambique
-
 Myanmar
-
 Namibia
-
 Nepal
Nepal
-
 Netherlands
-
 New Zealand
-
 Nigeria
-
 North Macedonia
-
 Norway
-
 Oman
Oman
-
 Pakistan
-
 Palestine
-
 Panama
-
 Papua New Guinea
-
 Paraguay
-
 Peru
Peru
-
 Philippines
-
 Poland
-
 Portugal
-
 Puerto Rico
-
 Qatar
Qatar
-
 Reunion
-
 Romania
-
 Rwanda
-
 Saudi Arabia
-
 Serbia
-
 Singapore
-
 Slovakia
-
 Slovenia
-
 Somalia
-
 South Africa
-
 Spain
Spain
-
 Sri Lanka
-
 Sweden
-
 Switzerland
-
 Syria
Syria
-
 Taiwan
-
 Tajikistan
-
 Tanzania
-
 Thailand
-
 Trinidad and Tobago
-
 Tunisia
-
 Turkey
-
 UAE
UAE
-
 Uganda
-
 Ukraine
-
 United Kingdom
-
United States
-
 Uruguay
-
 Uzbekistan
-
 Venezuela
-
 Vietnam
-
 Yemen
Yemen
-
 Zambia
-
 Zimbabwe
- Forex
- Crypto
