
+7.15% for Pendle as near-term resistance slows momentum

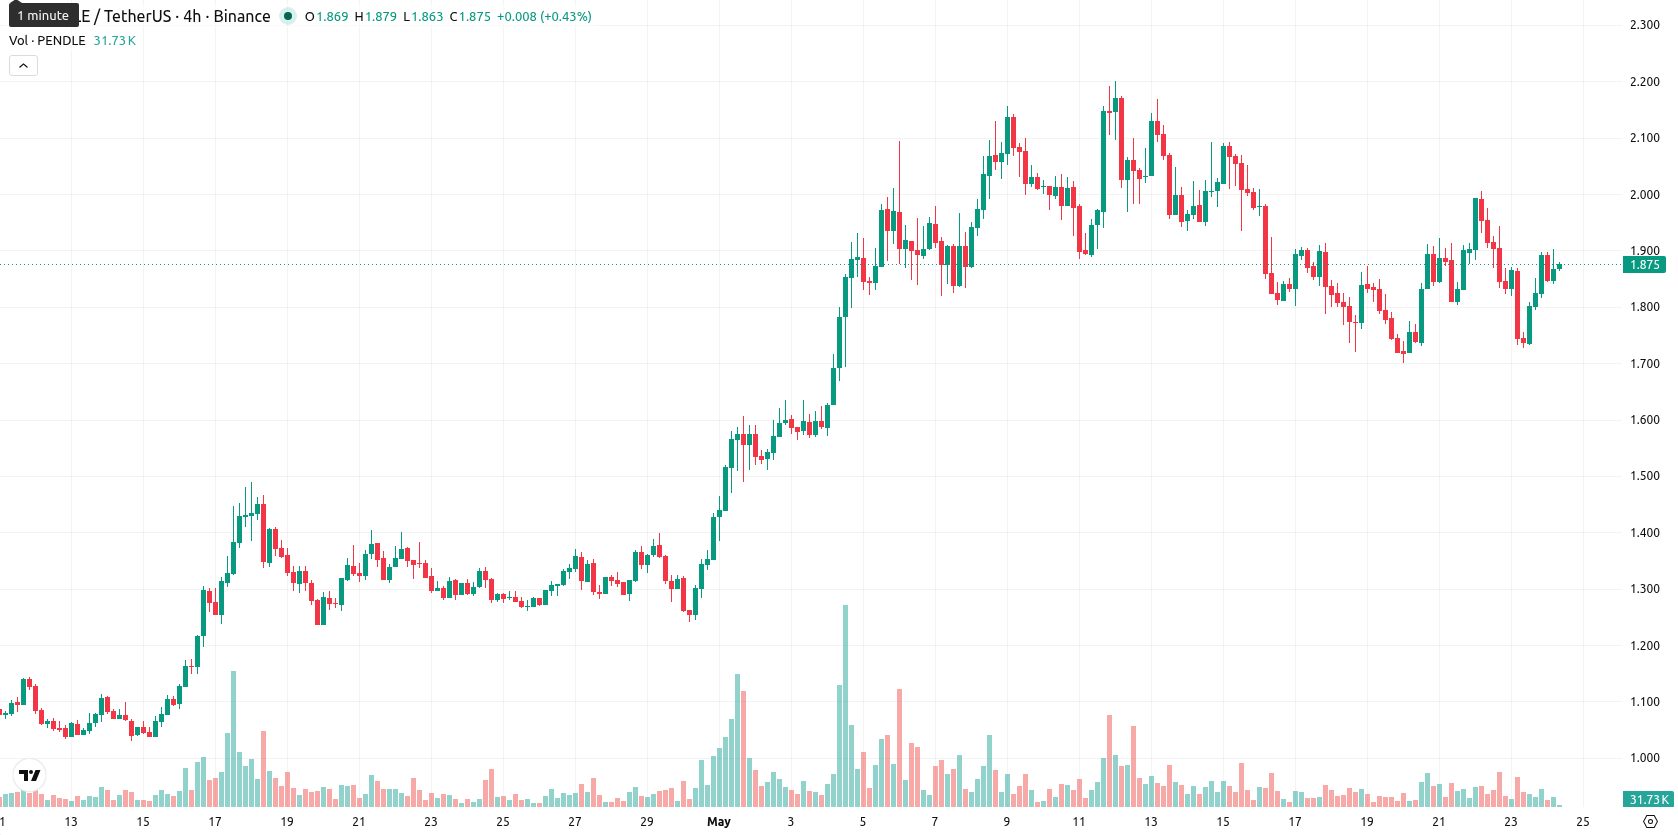
Pendle (PENDLE) is trading at $1.874, gaining 7.15% on the day. The asset currently sits above its key medium- and long-term moving averages, but remains below short-term levels, indicating some near-term resistance.
Highlights
- PENDLE trades above its medium- and long-term trend levels but has encountered short-term resistance near $1.93.
- Momentum indicators are largely bullish, but some short-term oscillators signal caution, reflecting heightened volatility this session.
- PENDLE is likely to consolidate between $1.81 and $2.10 over the next week, with downside risks outweighing upside potential.
Bullish momentum moderates as mixed signals emerge across indicators
On the technical front, PENDLE is positioned above the SMA-50 ($1.5201) and SMA-200 ($1.7376), while still trading below the SMA-20 ($1.9282). The Ichimoku Kijun level on the daily chart sits at $1.7210, acting as initial support. Momentum indicators on the daily timeframe signal underlying strength: MACD and ADX both suggest active bullish participation, and Bull/Bear Power (BBP) highlights ongoing buyer control. The RSI is at 55.72, which lies in a neutral zone, suggesting further room for movement without overbought stress. Meanwhile, Stoch RSI implies lingering upward pressure, though CCI remains cautious and the Awesome Oscillator is non-committal, pointing to mixed signals among short-term oscillators.
Sideways trend favored as breakout risk remains subdued
Over the next five sessions, PENDLE is likely to fluctuate within the $1.81 to $2.10 volatility band relative to current levels. The technical backdrop indicates that the probability of a sustained breakout to the upside is low, with less than a 20% chance of exceeding the $2.10 level. A move above $2.10 could open the door for further gains, while a downside scenario would be triggered by a breach of the $1.81 support, potentially leading to further declines. The base case remains a sideways trend between these boundaries.
Earlier, analysts noted that Pendle was experiencing heightened short-term volatility, mixed technical signals, and a lack of decisive bullish conviction. The latest analysis indicates that while upside potential remains limited in the near term, ongoing bullish momentum and buyer participation could tilt the balance, making $1.81 a critical level to monitor for potential downside risk in coming sessions.


-
 Afghanistan
-
 Albania
-
 Algeria
-
 Angola
-
 Argentina
-
 Armenia
-
 Australia
-
 Austria
-
 Azerbaijan
-
 Bahamas
-
 Bahrain
-
 Bangladesh
-
 Belarus
-
 Belgium
-
 Bolivia
-
 Botswana
-
 Brazil
-
 Brunei
-
 Bulgaria
-
 Cambodia
-
 Cameroon
-
 Canada
-
 Chile
Chile
-
 China
China
-
 Colombia
-
 Congo
Congo
-
 Costa Rica
-
 Cote d'Ivoire
-
 Croatia
-
 Cuba
Cuba
-
 Cyprus
-
 Czechia
-
 DR Congo
-
 Denmark
-
 Dominican Republic
-
 Ecuador
-
 Egypt
Egypt
-
 El Salvador
-
 Estonia
-
 Eswatini
-
 Ethiopia
-
 Finland
-
 France
-
 Georgia
-
 Germany
-
 Ghana
Ghana
-
 Greece
-
 Haiti
Haiti
-
 Hong Kong
-
 Hungary
-
 India
India
-
 Indonesia
-
 Iran, Islamic republic
-
 Iraq
Iraq
-
 Ireland
-
 Israel
-
 Italy
Italy
-
 Jamaica
-
 Japan
Japan
-
 Jordan
-
 Kazakhstan
-
 Kenya
Kenya
-
 Korea
Korea
-
 Kuwait
-
 Kyrgyzstan
-
 Laos
Laos
-
 Latvia
-
 Lebanon
-
 Lesotho
-
 Libya
Libya
-
 Lithuania
-
 Luxembourg
-
 Madagascar
-
 Malaysia
-
 Malta
Malta
-
 Mauritius
-
 Mexico
-
 Moldova
-
 Mongolia
-
 Montenegro
-
 Morocco
-
 Mozambique
-
 Myanmar
-
 Namibia
-
 Nepal
Nepal
-
 Netherlands
-
 New Zealand
-
 Nigeria
-
 North Macedonia
-
 Norway
-
 Oman
Oman
-
 Pakistan
-
 Palestine
-
 Panama
-
 Papua New Guinea
-
 Paraguay
-
 Peru
Peru
-
 Philippines
-
 Poland
-
 Portugal
-
 Puerto Rico
-
 Qatar
Qatar
-
 Reunion
-
 Romania
-
 Rwanda
-
 Saudi Arabia
-
 Serbia
-
 Singapore
-
 Slovakia
-
 Slovenia
-
 Somalia
-
 South Africa
-
 Spain
Spain
-
 Sri Lanka
-
 Sweden
-
 Switzerland
-
 Syria
Syria
-
 Taiwan
-
 Tajikistan
-
 Tanzania
-
 Thailand
-
 Trinidad and Tobago
-
 Tunisia
-
 Turkey
-
 UAE
UAE
-
 Uganda
-
 Ukraine
-
 United Kingdom
-
United States
-
 Uruguay
-
 Uzbekistan
-
 Venezuela
-
 Vietnam
-
 Yemen
Yemen
-
 Zambia
-
 Zimbabwe
- Forex
- Crypto
