
Render drops with momentum fading below long-term averages

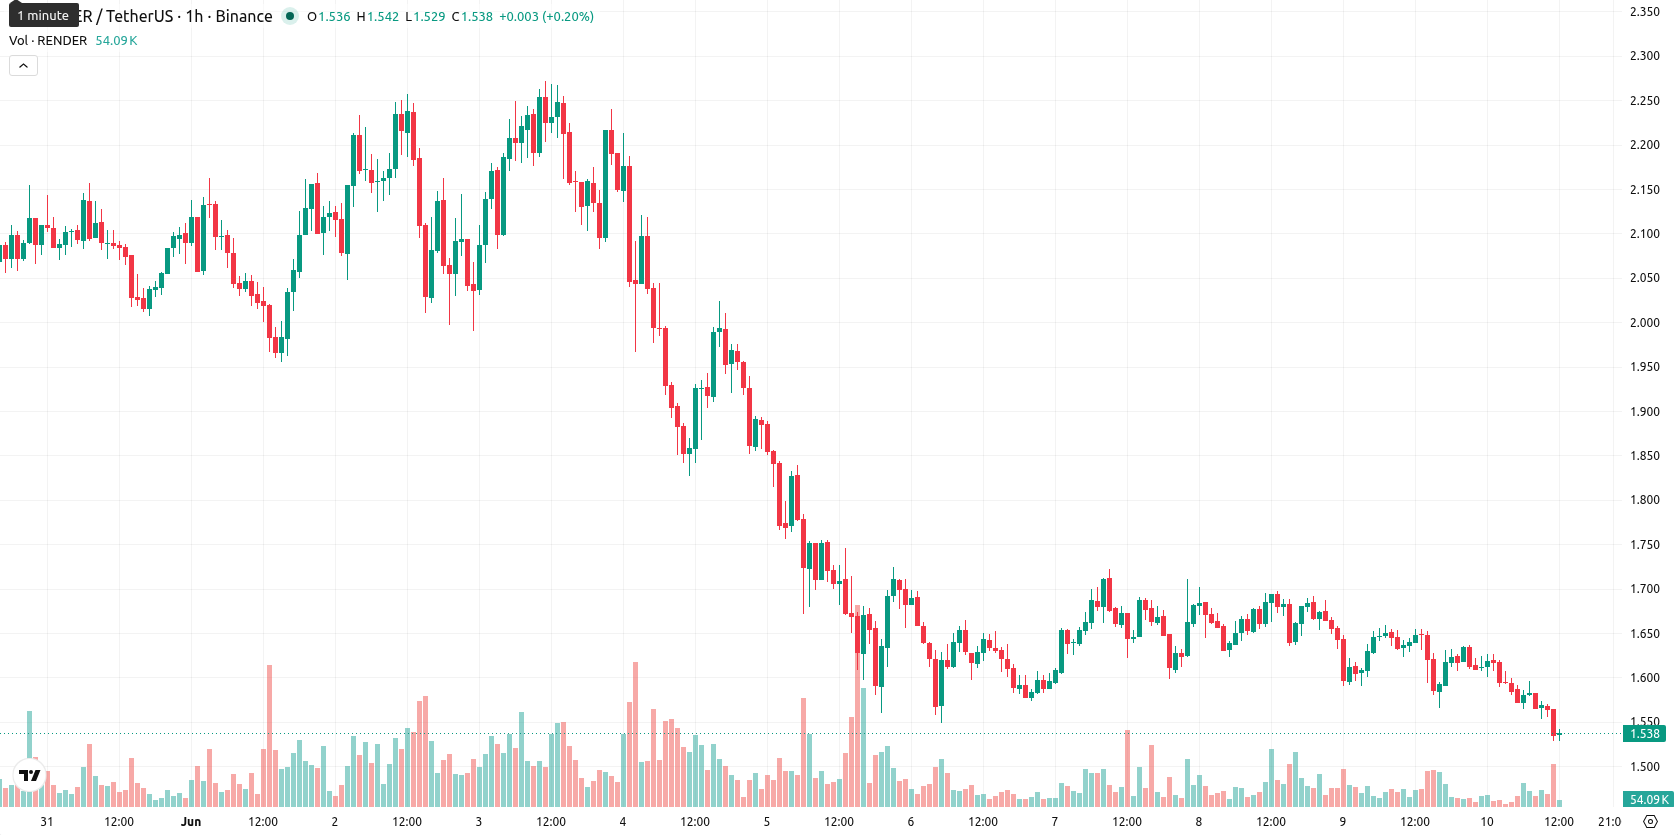
Render (RENDER) is trading at $1.532, down 7.38% on the day and currently positioned below its key moving averages.
Highlights
- Render (RNDR) continues to face bearish pressure, trading below key moving averages across multiple timeframes.
- Technical indicators overwhelmingly signal downside momentum, with oscillators in oversold territory and sellers dominating the session.
- RNDR's price is expected to range between $1.3320 and $1.6805 over the next 2–3 days, with high probability of further declines if support breaks.
Bearish momentum sustained as multiple indicators confirm seller dominance
On the technical side, RNDR is trading below its MA-20 ($1.5951), MA-50 ($1.6266), and the longer-term MA-200 ($1.7307) on the hourly chart, indicating sustained downside pressure at multiple timeframes. The Ichimoku Kijun level sits at $1.5915, which now forms the nearest resistance level. Key support can be found near $1.3320, while resistance stretches up to $1.6805. Momentum indicators confirm sellers' control: MACD, ADX, and AO are all on sell signals; RSI stands at 28.86, entering oversold territory, and both CCI and Stoch RSI also indicate oversold conditions. The BBP reading underscores that sellers continue to dominate intraday price action, with no bullish divergences present among oscillators.
Further downside risk as volatility maintains price within broad range
In the short term, typical volatility is expected to keep RNDR trading within the $1.3320–$1.6805 range over the next 2–3 sessions. The probability of a further downward move remains high, while an immediate bullish reversal appears unlikely. If support near $1.3320 fails, a move lower could be triggered quickly. Conversely, any break above resistance at $1.5915 would be required to challenge the upper boundary of the current range.
Earlier, analysts noted that Render was exhibiting persistent bearish momentum and heightened downside risk. The latest analysis reinforces this negative outlook, with sustained selling pressure and oversold conditions making a decisive break below the $1.3320 support an important level to monitor for further weakness.


-
 Afghanistan
-
 Albania
-
 Algeria
-
 Angola
-
 Argentina
-
 Armenia
-
 Australia
-
 Austria
-
 Azerbaijan
-
 Bahamas
-
 Bahrain
-
 Bangladesh
-
 Belarus
-
 Belgium
-
 Bolivia
-
 Botswana
-
 Brazil
-
 Brunei
-
 Bulgaria
-
 Cambodia
-
 Cameroon
-
 Canada
-
 Chile
Chile
-
 China
China
-
 Colombia
-
 Congo
Congo
-
 Costa Rica
-
 Cote d'Ivoire
-
 Croatia
-
 Cuba
Cuba
-
 Cyprus
-
 Czechia
-
 DR Congo
-
 Denmark
-
 Dominican Republic
-
 Ecuador
-
 Egypt
Egypt
-
 El Salvador
-
 Estonia
-
 Eswatini
-
 Ethiopia
-
 Finland
-
 France
-
 Georgia
-
 Germany
-
 Ghana
Ghana
-
 Greece
-
 Haiti
Haiti
-
 Hong Kong
-
 Hungary
-
 India
India
-
 Indonesia
-
 Iran, Islamic republic
-
 Iraq
Iraq
-
 Ireland
-
 Israel
-
 Italy
Italy
-
 Jamaica
-
 Japan
Japan
-
 Jordan
-
 Kazakhstan
-
 Kenya
Kenya
-
 Korea
Korea
-
 Kuwait
-
 Kyrgyzstan
-
 Laos
Laos
-
 Latvia
-
 Lebanon
-
 Lesotho
-
 Libya
Libya
-
 Lithuania
-
 Luxembourg
-
 Madagascar
-
 Malaysia
-
 Malta
Malta
-
 Mauritius
-
 Mexico
-
 Moldova
-
 Mongolia
-
 Montenegro
-
 Morocco
-
 Mozambique
-
 Myanmar
-
 Namibia
-
 Nepal
Nepal
-
 Netherlands
-
 New Zealand
-
 Nigeria
-
 North Macedonia
-
 Norway
-
 Oman
Oman
-
 Pakistan
-
 Palestine
-
 Panama
-
 Papua New Guinea
-
 Paraguay
-
 Peru
Peru
-
 Philippines
-
 Poland
-
 Portugal
-
 Puerto Rico
-
 Qatar
Qatar
-
 Reunion
-
 Romania
-
 Rwanda
-
 Saudi Arabia
-
 Serbia
-
 Singapore
-
 Slovakia
-
 Slovenia
-
 Somalia
-
 South Africa
-
 Spain
Spain
-
 Sri Lanka
-
 Sweden
-
 Switzerland
-
 Syria
Syria
-
 Taiwan
-
 Tajikistan
-
 Tanzania
-
 Thailand
-
 Trinidad and Tobago
-
 Tunisia
-
 Turkey
-
 UAE
UAE
-
 Uganda
-
 Ukraine
-
 United Kingdom
-
United States
-
 Uruguay
-
 Uzbekistan
-
 Venezuela
-
 Vietnam
-
 Yemen
Yemen
-
 Zambia
-
 Zimbabwe
- Forex
- Crypto
