
Steady price for Bitcoin as higher-than-expected US inflation data sparks caution

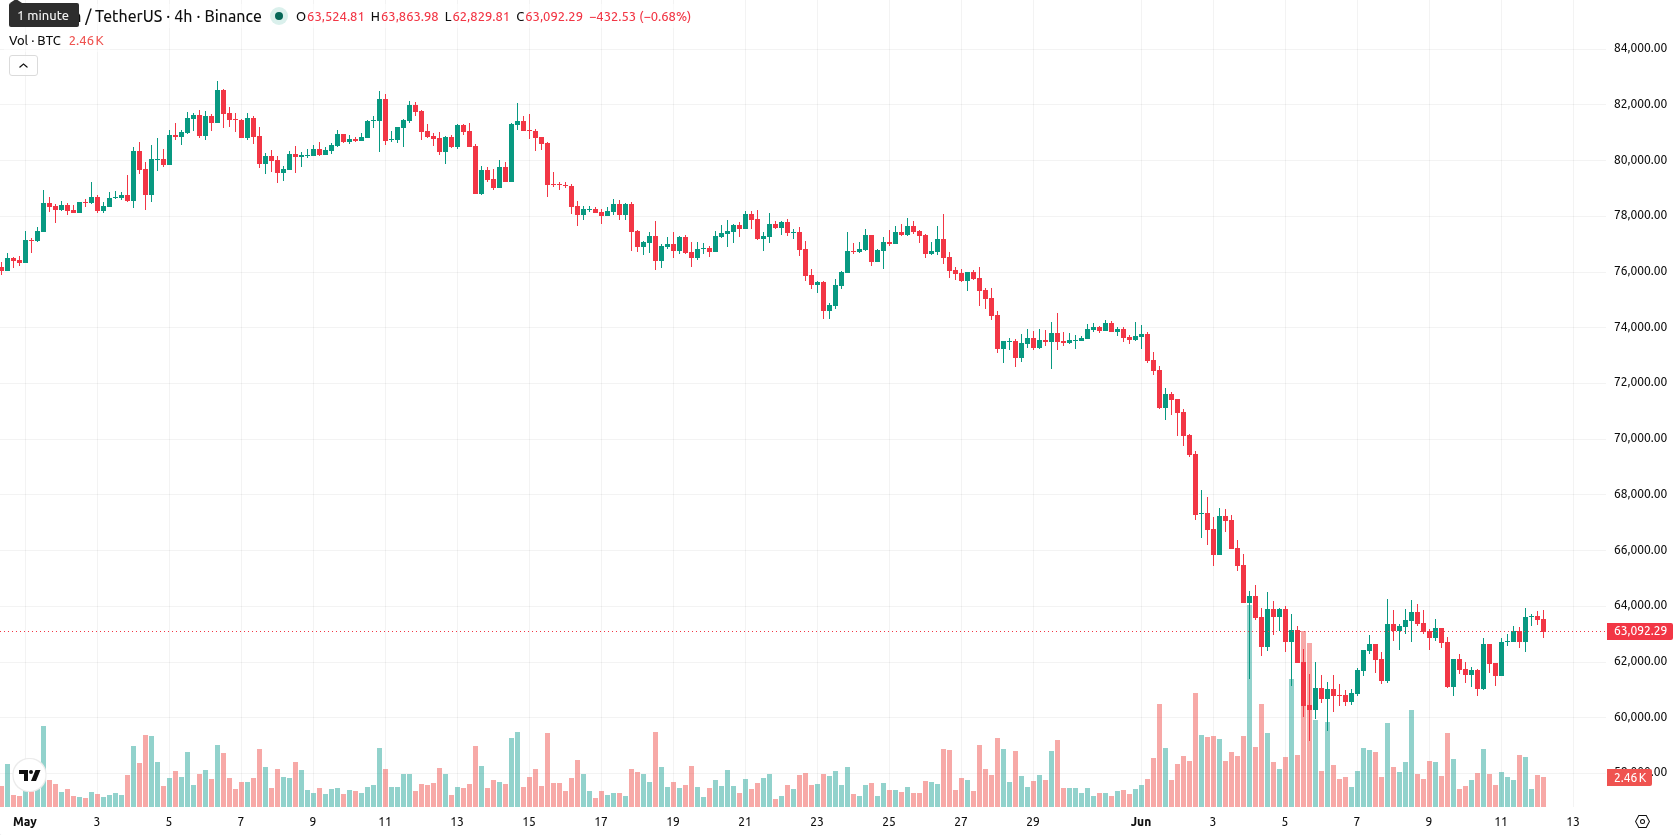
Bitcoin (BTC) is trading at $62,963.06, up 0.22% on the day. The price currently sits above its key short- and medium-term moving averages but remains under pressure from longer-term averages.
Highlights
- US military actions against Iran and the closure of the Strait of Hormuz triggered a 2% Bitcoin drop to $61,000 amid heightened geopolitical risk.
- Iran’s pivot to accepting Bitcoin and stablecoins for vessel transit payments signals new sanctions evasion tactics, adding to market instability.
- Technicals indicate short-term strength but persistent longer-term bearish pressure, with volatility elevated and Bitcoin likely to consolidate between $60,845.65 and $66,543.72 in coming days.
Risk-off flows drive Bitcoin selloff amid Middle East escalation and ETF outflows
US military strikes against Iran have triggered a selloff in Bitcoin, resulting in a 2% drop to $61,000 as intensifying geopolitical risk has driven crypto investors to reduce exposure to risk assets. Iran's closure of the Strait of Hormuz and its demand for Bitcoin and stablecoin payments for vessel transit have introduced a new sanctions evasion infrastructure and further destabilized global markets. Higher-than-expected US inflation data, combined with escalating Middle East conflict and record spot Bitcoin ETF outflows, have reinforced a risk-off environment, prompting institutional selling and amplifying volatility.
Overbought signals and weak trend as oscillators outpace moving averages
On the h4 chart, BTC is trading above the MA-20 level at $62,459.63 and the MA-50 at $62,403.01, with immediate support offered by the Ichimoku Kijun at $62,494.84. However, it remains below the daily MA-200, set at $78,043.82. RSI is at 55.5, signaling a mild bullish bias, while the MACD is neutral and the ADX points to prevailing weakness in market trend. Stoch RSI, CCI, and Bull/Bear Power (BBP) all suggest overbought conditions, though the Awesome Oscillator is positive and supports recent bullish momentum. This combination of overbought oscillators and moderate volatility highlights potential risk for short-term positions.
Consolidation expected as breakout risks tilt toward downside
Over the next two to three trading days, BTC/USD is likely to consolidate within a typical volatility band from $60,845.65 to $66,543.72. There is a 45% probability of an upward breakout, while chances for a downward move are somewhat higher. If BTC breaks above resistance levels, a bullish scenario could unfold; if the price drops decisively below support, a bearish outcome would be confirmed.
Previously it was reported that Bitcoin was expected to consolidate amid evolving regulatory developments and mixed technical signals, with institutional demand playing an increasingly significant role. The current geopolitical and macroeconomic shocks introduce heightened downside risk, making it critical for traders to monitor for potential volatility spikes should support below $60,800 fail or resistance breakouts occur.


Latest Bitcoin News


-
 Afghanistan
-
 Albania
-
 Algeria
-
 Angola
-
 Argentina
-
 Armenia
-
 Australia
-
 Austria
-
 Azerbaijan
-
 Bahamas
-
 Bahrain
-
 Bangladesh
-
 Belarus
-
 Belgium
-
 Bolivia
-
 Botswana
-
 Brazil
-
 Brunei
-
 Bulgaria
-
 Cambodia
-
 Cameroon
-
 Canada
-
 Chile
Chile
-
 China
China
-
 Colombia
-
 Congo
Congo
-
 Costa Rica
-
 Cote d'Ivoire
-
 Croatia
-
 Cuba
Cuba
-
 Cyprus
-
 Czechia
-
 DR Congo
-
 Denmark
-
 Dominican Republic
-
 Ecuador
-
 Egypt
Egypt
-
 El Salvador
-
 Estonia
-
 Eswatini
-
 Ethiopia
-
 Finland
-
 France
-
 Georgia
-
 Germany
-
 Ghana
Ghana
-
 Greece
-
 Haiti
Haiti
-
 Hong Kong
-
 Hungary
-
 India
India
-
 Indonesia
-
 Iran, Islamic republic
-
 Iraq
Iraq
-
 Ireland
-
 Israel
-
 Italy
Italy
-
 Jamaica
-
 Japan
Japan
-
 Jordan
-
 Kazakhstan
-
 Kenya
Kenya
-
 Korea
Korea
-
 Kuwait
-
 Kyrgyzstan
-
 Laos
Laos
-
 Latvia
-
 Lebanon
-
 Lesotho
-
 Libya
Libya
-
 Lithuania
-
 Luxembourg
-
 Madagascar
-
 Malaysia
-
 Malta
Malta
-
 Mauritius
-
 Mexico
-
 Moldova
-
 Mongolia
-
 Montenegro
-
 Morocco
-
 Mozambique
-
 Myanmar
-
 Namibia
-
 Nepal
Nepal
-
 Netherlands
-
 New Zealand
-
 Nigeria
-
 North Macedonia
-
 Norway
-
 Oman
Oman
-
 Pakistan
-
 Palestine
-
 Panama
-
 Papua New Guinea
-
 Paraguay
-
 Peru
Peru
-
 Philippines
-
 Poland
-
 Portugal
-
 Puerto Rico
-
 Qatar
Qatar
-
 Reunion
-
 Romania
-
 Rwanda
-
 Saudi Arabia
-
 Serbia
-
 Singapore
-
 Slovakia
-
 Slovenia
-
 Somalia
-
 South Africa
-
 Spain
Spain
-
 Sri Lanka
-
 Sweden
-
 Switzerland
-
 Syria
Syria
-
 Taiwan
-
 Tajikistan
-
 Tanzania
-
 Thailand
-
 Trinidad and Tobago
-
 Tunisia
-
 Turkey
-
 UAE
UAE
-
 Uganda
-
 Ukraine
-
 United Kingdom
-
United States
-
 Uruguay
-
 Uzbekistan
-
 Venezuela
-
 Vietnam
-
 Yemen
Yemen
-
 Zambia
-
 Zimbabwe
- Forex
- Crypto
