
Ongoing seller dominance pressures DeXe to fresh losses

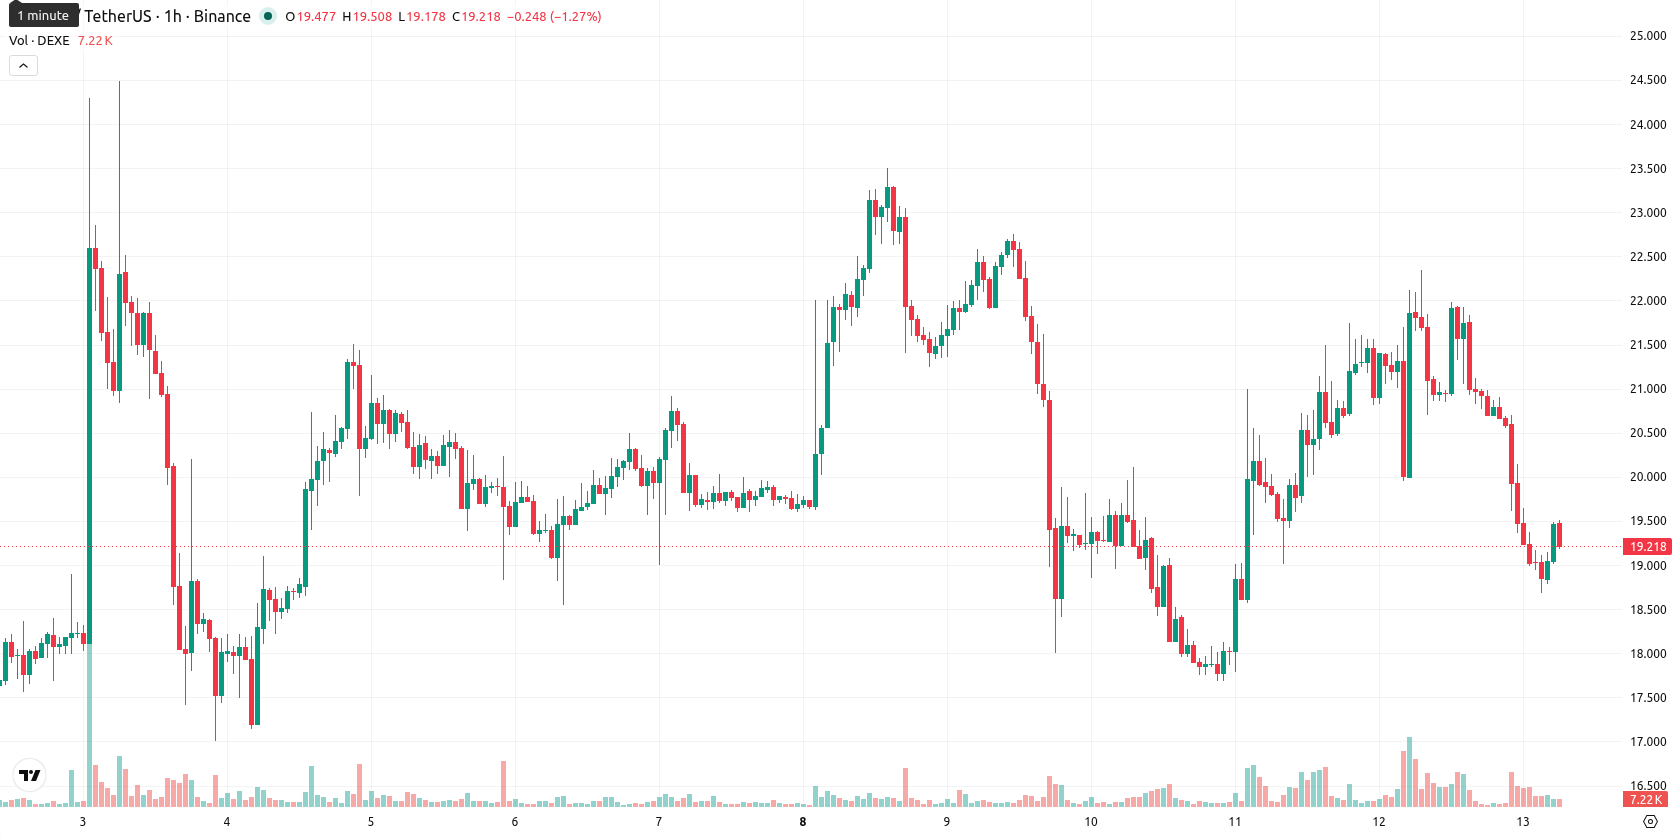
DeXe (DEXE) is trading at $19.32, down 11.46% for the session and showing clear short-term weakness, with the price positioned below its key moving averages.
Highlights
- DEXE/USD faces sustained intraday selling pressure, trading below key short-term moving averages despite a bullish long-term technical structure.
- Momentum indicators and oscillators align in signaling broad downside, with oversold conditions dominating the current price action.
- Price is forecast to range between $18.02 and $20.62 over the next day, with a 73% probability of further downside and critical resistance at $20.51.
Bearish momentum builds as resistance and oscillators cap rebound
On the hourly chart, DEXE/USD is trading below both its MA-20 ($20.34) and MA-50 ($20.58), while still remaining well above the long-term MA-200 ($7.31) on the daily timeframe. The Ichimoku Kijun level at $20.51 serves as immediate resistance. Technical indicators show decisive negative momentum: RSI is at 39.44 (Sell), MACD and ADX point to further downside, and CCI is on a Sell reading. Stoch RSI is Neutral, and BBP reflects an oversold condition, illustrating seller dominance within intraday action. Overall, momentum and oscillators align to highlight broad downside pressure with minimal short-term support from the oscillators.
Downside risk prevails as breakout chances remain limited
Over the next trading day, DEXE/USD is expected to trade within a volatility band bounded by $18.02 on the downside and $20.62 on the upside. There is a 27% probability of an upward move and a 73% probability of continued downside, making a bullish reversal significantly less likely. The baseline scenario expects sideways price action within this corridor; a bullish scenario would require a breakout above $20.51 resistance, while a drop below $18.02 support would indicate further bearish extension.
Earlier, analysts noted that DeXe was exhibiting sustained bullish momentum with broad buying support across multiple timeframes. The latest shift to decisive negative momentum and dominance by sellers marks a clear change in the short-term outlook, making the price response at the $18.02 support a crucial level for determining near-term risk and potential reversal.


Latest DeXe News


-
 Afghanistan
-
 Albania
-
 Algeria
-
 Angola
-
 Argentina
-
 Armenia
-
 Australia
-
 Austria
-
 Azerbaijan
-
 Bahamas
-
 Bahrain
-
 Bangladesh
-
 Belarus
-
 Belgium
-
 Bolivia
-
 Botswana
-
 Brazil
-
 Brunei
-
 Bulgaria
-
 Cambodia
-
 Cameroon
-
 Canada
-
 Chile
Chile
-
 China
China
-
 Colombia
-
 Congo
Congo
-
 Costa Rica
-
 Cote d'Ivoire
-
 Croatia
-
 Cuba
Cuba
-
 Cyprus
-
 Czechia
-
 DR Congo
-
 Denmark
-
 Dominican Republic
-
 Ecuador
-
 Egypt
Egypt
-
 El Salvador
-
 Estonia
-
 Eswatini
-
 Ethiopia
-
 Finland
-
 France
-
 Georgia
-
 Germany
-
 Ghana
Ghana
-
 Greece
-
 Haiti
Haiti
-
 Hong Kong
-
 Hungary
-
 India
India
-
 Indonesia
-
 Iran, Islamic republic
-
 Iraq
Iraq
-
 Ireland
-
 Israel
-
 Italy
Italy
-
 Jamaica
-
 Japan
Japan
-
 Jordan
-
 Kazakhstan
-
 Kenya
Kenya
-
 Korea
Korea
-
 Kuwait
-
 Kyrgyzstan
-
 Laos
Laos
-
 Latvia
-
 Lebanon
-
 Lesotho
-
 Libya
Libya
-
 Lithuania
-
 Luxembourg
-
 Madagascar
-
 Malaysia
-
 Malta
Malta
-
 Mauritius
-
 Mexico
-
 Moldova
-
 Mongolia
-
 Montenegro
-
 Morocco
-
 Mozambique
-
 Myanmar
-
 Namibia
-
 Nepal
Nepal
-
 Netherlands
-
 New Zealand
-
 Nigeria
-
 North Macedonia
-
 Norway
-
 Oman
Oman
-
 Pakistan
-
 Palestine
-
 Panama
-
 Papua New Guinea
-
 Paraguay
-
 Peru
Peru
-
 Philippines
-
 Poland
-
 Portugal
-
 Puerto Rico
-
 Qatar
Qatar
-
 Reunion
-
 Romania
-
 Rwanda
-
 Saudi Arabia
-
 Serbia
-
 Singapore
-
 Slovakia
-
 Slovenia
-
 Somalia
-
 South Africa
-
 Spain
Spain
-
 Sri Lanka
-
 Sweden
-
 Switzerland
-
 Syria
Syria
-
 Taiwan
-
 Tajikistan
-
 Tanzania
-
 Thailand
-
 Trinidad and Tobago
-
 Tunisia
-
 Turkey
-
 UAE
UAE
-
 Uganda
-
 Ukraine
-
 United Kingdom
-
United States
-
 Uruguay
-
 Uzbekistan
-
 Venezuela
-
 Vietnam
-
 Yemen
Yemen
-
 Zambia
-
 Zimbabwe
- Forex
- Crypto
