
Hedera price prediction: Can $0.1006 resistance hold as HBAR rallies 7.42%?

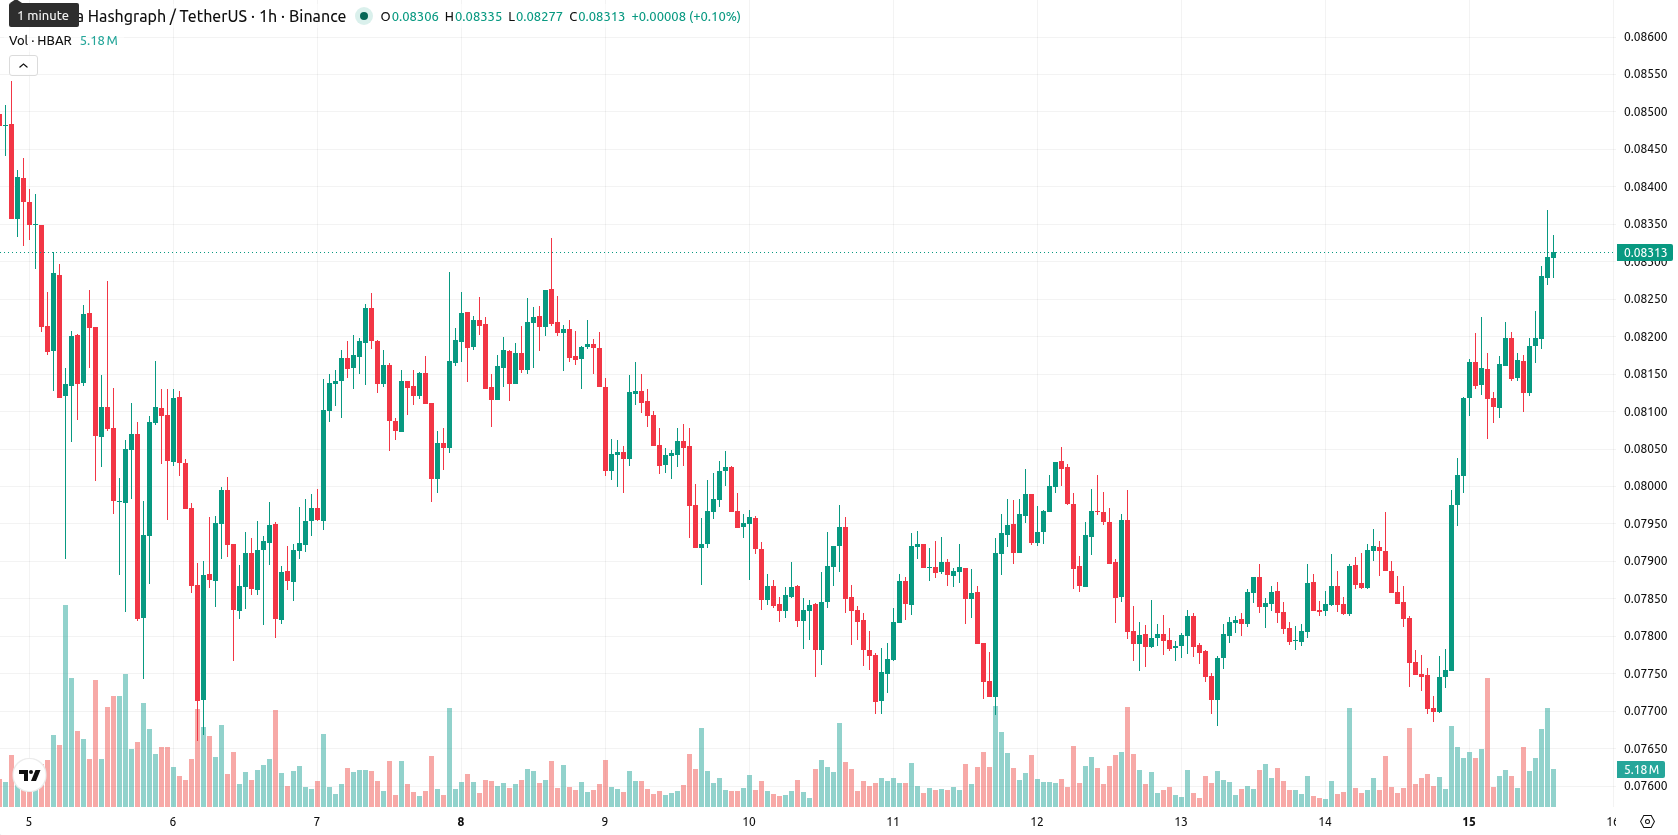
Hedera (HBAR) is trading at $0.0831, up 7.42% on the day. The asset sits above its key short- and medium-term moving averages but remains below its long-term average.
Highlights
- Hedera's mainnet upgrade and $250 million HBAR OTC moves expand institutional access and support enterprise network adoption.
- Regulatory approval for a crypto ETF allocating to HBAR enhances regulated capital inflows and broadens market participation.
- HBAR trades with bullish short-term momentum, projected to consolidate between $0.0812 and $0.0842 amid buy-side dominance.
Institutional inflows rise as upgrade and ETF boost adoption prospects
The Hedera mainnet upgrade on June 10, accompanied by the release of version 0.74 and $250 million in HBAR moved over-the-counter by large holders, directly expands institutional access and highlights a significant technical step aimed at improving enterprise adoption, according to Live Bitcoin News. These coordinated transactions can improve network liquidity by allowing major stakeholders to reposition without impacting open market trading, while the software upgrade strengthens Hedera's operational appeal for enterprise clients. Furthermore, the SEC's approval of NYSE Arca's proposal to list the T. Rowe Price Active Crypto ETF, which allocates to HBAR as reported by Coingape, increases regulated pathways for capital inflows and supports broader market participation.
Overbought momentum persists as resistance holds and signals warn
On the H1 chart, HBAR/USD is trading above the MA-20 at $0.0809 and the MA-50 at $0.0794, with price action remaining under the MA-200 on the daily timeframe at $0.1006. The Ichimoku Kijun level at $0.0803 serves as immediate support. Momentum indicators including MACD, ADX, and the Awesome Oscillator highlight ongoing strong upward pressure. RSI is elevated at 71.8369, with CCI also signaling overbought conditions, while Stoch RSI is neutral and Bull/Bear Power indicates buyer dominance. While momentum signals are robust, oscillators suggest some caution as overbought readings emerge.
Upside favored as consolidation expected within volatility band
Over the next two to three sessions, HBAR is expected to consolidate within a typical volatility band between $0.0812 and $0.0842. The probability of further upside remains very high, while the likelihood of a reversal is viewed as low. The base case scenario is for price to trade within the defined support and resistance levels. Should HBAR break above resistance, additional gains may follow, while a move below immediate support could trigger a brief retracement.
Previously it was reported that Hedera was experiencing entrenched bearish momentum, with technical indicators and price action signaling a sustained downtrend despite positive enterprise developments. The current sharp upward move, driven by new institutional access and technical upgrades, signals a possible shift in sentiment, and traders should monitor whether sustained buying pressure leads to a decisive break above the long-term moving average, which could mark the start of a broader reversal.


-
 Afghanistan
-
 Albania
-
 Algeria
-
 Angola
-
 Argentina
-
 Armenia
-
 Australia
-
 Austria
-
 Azerbaijan
-
 Bahamas
-
 Bahrain
-
 Bangladesh
-
 Belarus
-
 Belgium
-
 Bolivia
-
 Botswana
-
 Brazil
-
 Brunei
-
 Bulgaria
-
 Cambodia
-
 Cameroon
-
 Canada
-
 Chile
Chile
-
 China
China
-
 Colombia
-
 Congo
Congo
-
 Costa Rica
-
 Cote d'Ivoire
-
 Croatia
-
 Cuba
Cuba
-
 Cyprus
-
 Czechia
-
 DR Congo
-
 Denmark
-
 Dominican Republic
-
 Ecuador
-
 Egypt
Egypt
-
 El Salvador
-
 Estonia
-
 Eswatini
-
 Ethiopia
-
 Finland
-
 France
-
 Georgia
-
 Germany
-
 Ghana
Ghana
-
 Greece
-
 Haiti
Haiti
-
 Hong Kong
-
 Hungary
-
 India
India
-
 Indonesia
-
 Iran, Islamic republic
-
 Iraq
Iraq
-
 Ireland
-
 Israel
-
 Italy
Italy
-
 Jamaica
-
 Japan
Japan
-
 Jordan
-
 Kazakhstan
-
 Kenya
Kenya
-
 Korea
Korea
-
 Kuwait
-
 Kyrgyzstan
-
 Laos
Laos
-
 Latvia
-
 Lebanon
-
 Lesotho
-
 Libya
Libya
-
 Lithuania
-
 Luxembourg
-
 Madagascar
-
 Malaysia
-
 Malta
Malta
-
 Mauritius
-
 Mexico
-
 Moldova
-
 Mongolia
-
 Montenegro
-
 Morocco
-
 Mozambique
-
 Myanmar
-
 Namibia
-
 Nepal
Nepal
-
 Netherlands
-
 New Zealand
-
 Nigeria
-
 North Macedonia
-
 Norway
-
 Oman
Oman
-
 Pakistan
-
 Palestine
-
 Panama
-
 Papua New Guinea
-
 Paraguay
-
 Peru
Peru
-
 Philippines
-
 Poland
-
 Portugal
-
 Puerto Rico
-
 Qatar
Qatar
-
 Reunion
-
 Romania
-
 Rwanda
-
 Saudi Arabia
-
 Serbia
-
 Singapore
-
 Slovakia
-
 Slovenia
-
 Somalia
-
 South Africa
-
 Spain
Spain
-
 Sri Lanka
-
 Sweden
-
 Switzerland
-
 Syria
Syria
-
 Taiwan
-
 Tajikistan
-
 Tanzania
-
 Thailand
-
 Trinidad and Tobago
-
 Tunisia
-
 Turkey
-
 UAE
UAE
-
 Uganda
-
 Ukraine
-
 United Kingdom
-
United States
-
 Uruguay
-
 Uzbekistan
-
 Venezuela
-
 Vietnam
-
 Yemen
Yemen
-
 Zambia
-
 Zimbabwe
- Forex
- Crypto
