
Bitcoin trades down as OFAC sanctions hit Sinbad.io

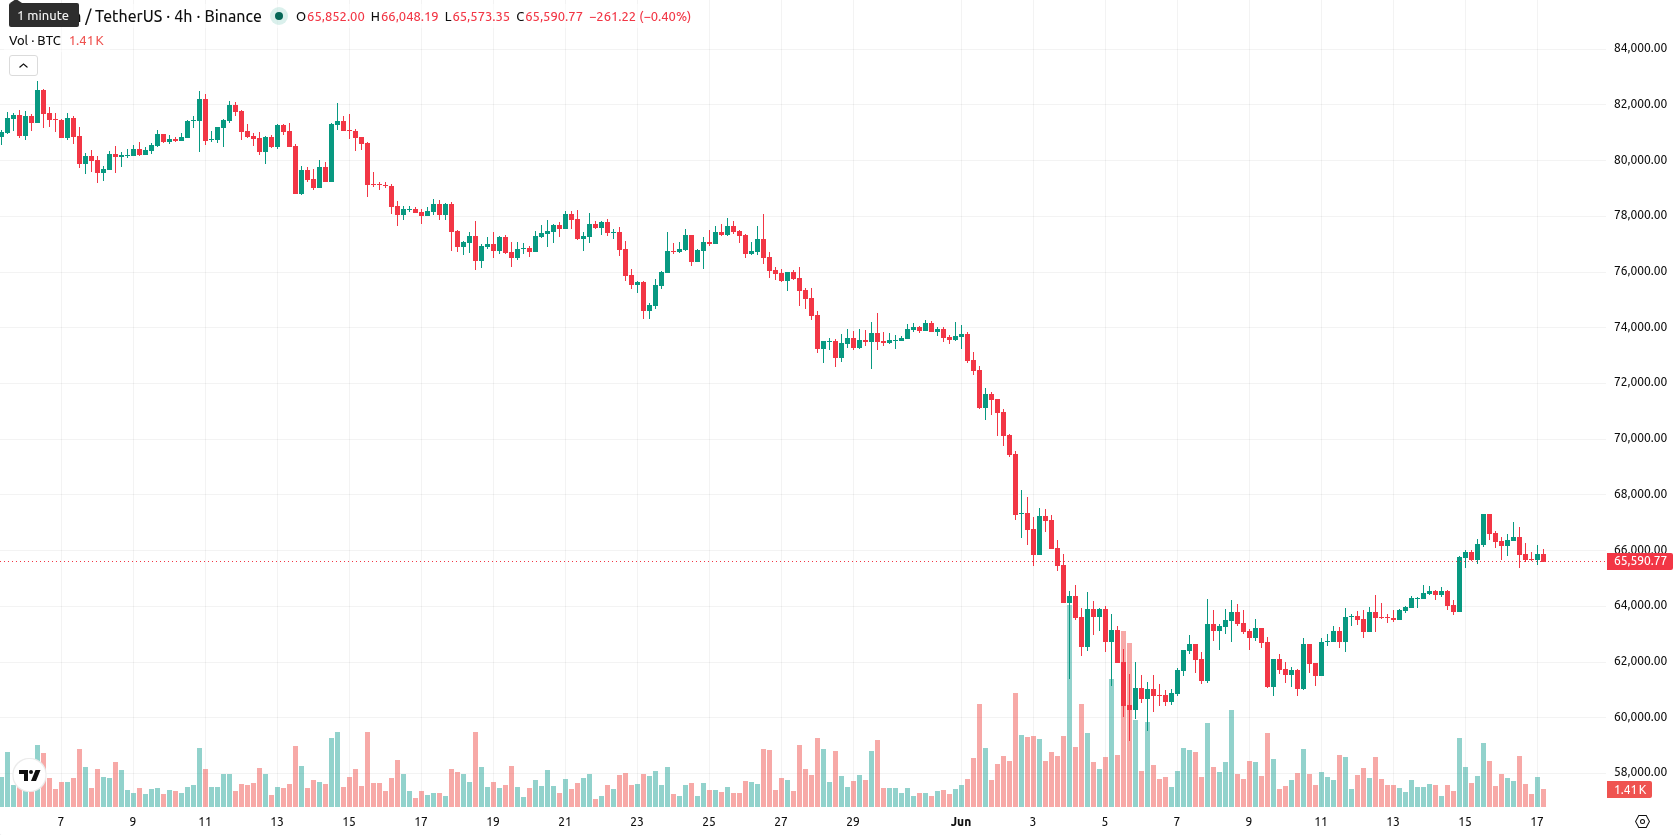
Bitcoin (BTC) is trading at $65,612.02, recording a daily decline of 1.23%. The asset sits above its key short- and medium-term moving averages but remains under long-term pressure.
Highlights
- A preliminary US-Iran peace deal to reopen the Strait of Hormuz and lift port blockades may ease inflation and shift risk sentiment in crypto markets.
- Ongoing Western regulatory actions and FATF scrutiny of crypto AML risks heighten compliance uncertainty for non-custodial wallets and service providers.
- BTC/USD trades with short-term bullish momentum but faces mixed technical signals, with a likely range of $63,026.61 to $69,130.37 over the next few days.
Peace talks and regulatory scrutiny shift global crypto sentiment
On Sunday, the United States and Iran reached a preliminary peace agreement that includes reopening the Strait of Hormuz and lifting the US blockade of Iranian ports, following months of conflict. The arrangement commits both countries to 60 days of negotiations on Iran’s nuclear program and potential sanctions relief, which may influence global inflation expectations and general risk appetite. Meanwhile, intensified enforcement actions by Western regulators—such as the OFAC's sanctions on Sinbad.io in November 2023 and recent measures against Garantex—have heightened compliance risks for crypto intermediaries. Additionally, a March 2026 FATF report has highlighted ongoing anti-money laundering vulnerabilities related to non-custodial Bitcoin wallets and P2P transactions, adding to the sector’s regulatory uncertainty.
Divergent oscillator signals as technical boundaries tighten
The current technical configuration for BTC features the MA-20 and MA-50 positioned above the spot price, while the MA-200 remains overhead, signaling longer-term resistance. The Ichimoku Kijun is set at $65,346.08 and acts as immediate support. Among oscillators, MACD provides a strong buy momentum signal, ADX is neutral, RSI sits at 56.21, Stoch RSI signals oversold conditions, and CCI remains in a neutral zone. BBP points to overbought buyer dominance, while the Awesome Oscillator is neutral—together, these indicate a divergence and growing uncertainty.
Sideways bias dominates as volatility constrains breakout risks
BTC is likely to remain within the $63,026.61 to $69,130.37 band over the next 2–3 trading days, reflecting typical volatility for the asset. An upward move has a 58% probability, and a downside move is less probable at 42%. The baseline expectation is for sideways trading inside this corridor. A sustained breakout above resistance would target the range highs, while a breach below immediate support could open the door for further declines toward the lower end of the band.
Earlier, analysts noted that Bitcoin maintained a slight upside bias amid regulatory developments and the launch of new ETF products, with price action expected to remain within a typical volatility band. The latest geopolitical and regulatory shifts introduce fresh catalysts that may influence volatility and risk appetite, making it critical for traders to monitor any breakout from the current $63,026.61–$69,130.37 trading range for early signs of directional momentum.


Latest Bitcoin News


-
 Afghanistan
-
 Albania
-
 Algeria
-
 Angola
-
 Argentina
-
 Armenia
-
 Australia
-
 Austria
-
 Azerbaijan
-
 Bahamas
-
 Bahrain
-
 Bangladesh
-
 Belarus
-
 Belgium
-
 Bolivia
-
 Botswana
-
 Brazil
-
 Brunei
-
 Bulgaria
-
 Cambodia
-
 Cameroon
-
 Canada
-
 Chile
Chile
-
 China
China
-
 Colombia
-
 Congo
Congo
-
 Costa Rica
-
 Cote d'Ivoire
-
 Croatia
-
 Cuba
Cuba
-
 Cyprus
-
 Czechia
-
 DR Congo
-
 Denmark
-
 Dominican Republic
-
 Ecuador
-
 Egypt
Egypt
-
 El Salvador
-
 Estonia
-
 Eswatini
-
 Ethiopia
-
 Finland
-
 France
-
 Georgia
-
 Germany
-
 Ghana
Ghana
-
 Greece
-
 Haiti
Haiti
-
 Hong Kong
-
 Hungary
-
 India
India
-
 Indonesia
-
 Iran, Islamic republic
-
 Iraq
Iraq
-
 Ireland
-
 Israel
-
 Italy
Italy
-
 Jamaica
-
 Japan
Japan
-
 Jordan
-
 Kazakhstan
-
 Kenya
Kenya
-
 Korea
Korea
-
 Kuwait
-
 Kyrgyzstan
-
 Laos
Laos
-
 Latvia
-
 Lebanon
-
 Lesotho
-
 Libya
Libya
-
 Lithuania
-
 Luxembourg
-
 Madagascar
-
 Malaysia
-
 Malta
Malta
-
 Mauritius
-
 Mexico
-
 Moldova
-
 Mongolia
-
 Montenegro
-
 Morocco
-
 Mozambique
-
 Myanmar
-
 Namibia
-
 Nepal
Nepal
-
 Netherlands
-
 New Zealand
-
 Nigeria
-
 North Macedonia
-
 Norway
-
 Oman
Oman
-
 Pakistan
-
 Palestine
-
 Panama
-
 Papua New Guinea
-
 Paraguay
-
 Peru
Peru
-
 Philippines
-
 Poland
-
 Portugal
-
 Puerto Rico
-
 Qatar
Qatar
-
 Reunion
-
 Romania
-
 Rwanda
-
 Saudi Arabia
-
 Serbia
-
 Singapore
-
 Slovakia
-
 Slovenia
-
 Somalia
-
 South Africa
-
 Spain
Spain
-
 Sri Lanka
-
 Sweden
-
 Switzerland
-
 Syria
Syria
-
 Taiwan
-
 Tajikistan
-
 Tanzania
-
 Thailand
-
 Trinidad and Tobago
-
 Tunisia
-
 Turkey
-
 UAE
UAE
-
 Uganda
-
 Ukraine
-
 United Kingdom
-
United States
-
 Uruguay
-
 Uzbekistan
-
 Venezuela
-
 Vietnam
-
 Yemen
Yemen
-
 Zambia
-
 Zimbabwe
- Forex
- Crypto
