
Ethereum dips amid sellers dominating short-term trend

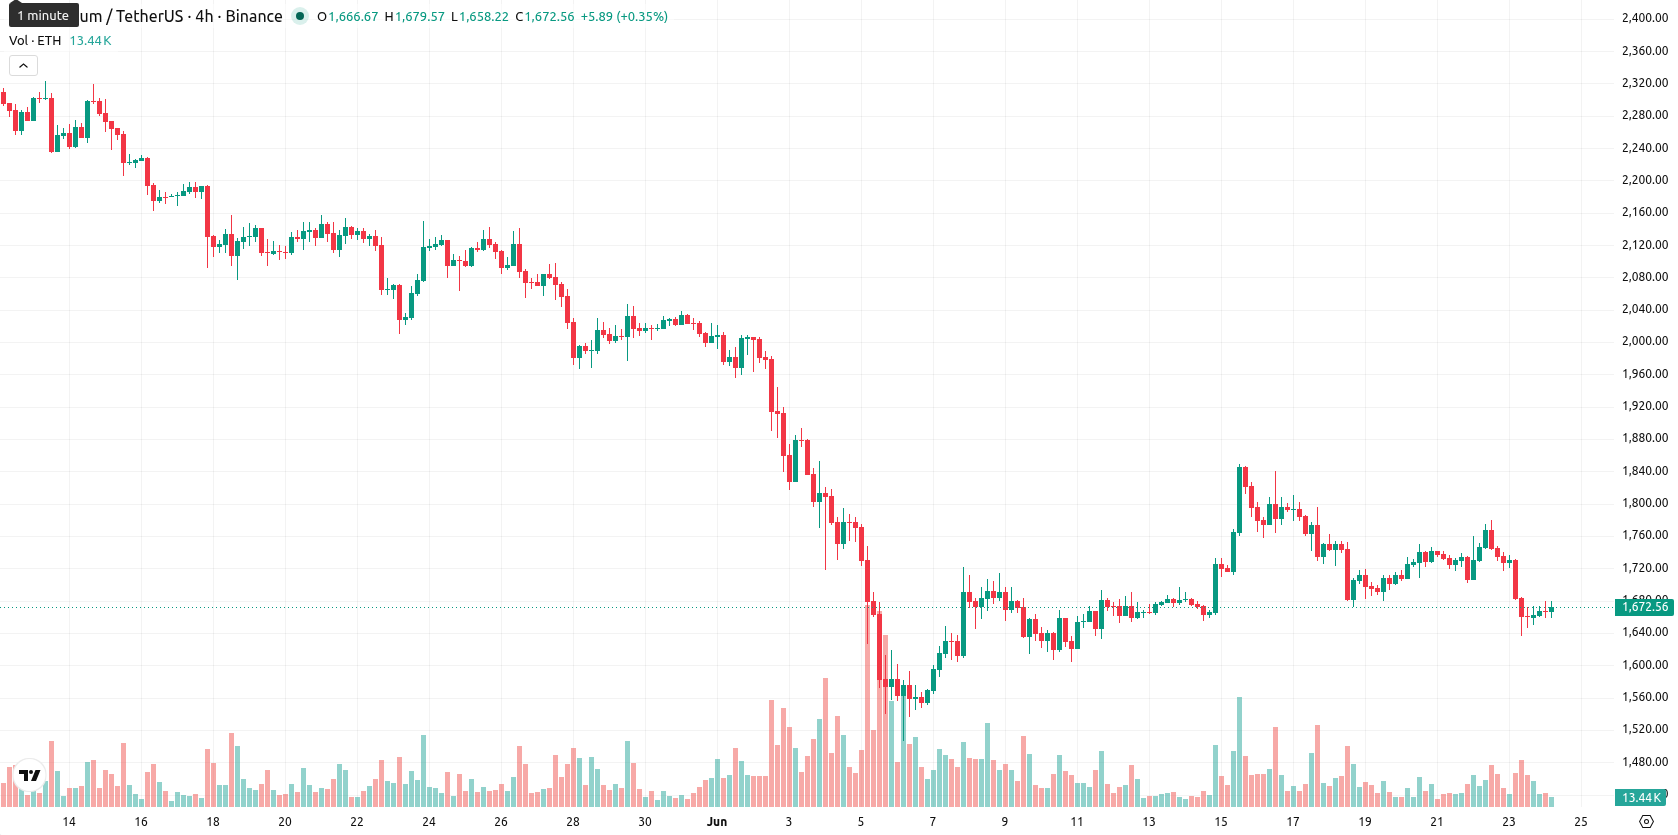
Ethereum (ETH) is trading at $1,674.48, down 2.19% on the day and positioned below its key moving averages.
Highlights
- The June 2026 US-Iran ceasefire eliminated a major geopolitical risk, improving macro sentiment towards Ethereum and boosting institutional appetite.
- Reduction in conflict has shifted Ethereum's behavior towards greater alignment with global market cycles and monetary policy risk exposure.
- ETH/USD remains in a bearish technical structure, trading below key moving averages, with a projected range of $1,579 to $1,738 and a 76% probability of further downside.
Risk appetite shifts after US-Iran ceasefire reduces uncertainty
A ceasefire between the US and Iran was confirmed in June 2026, removing a major source of macroeconomic and geopolitical risk and recalibrating risk sentiment for Ethereum, according to Mexc. Historically, periods of US-Iran conflict saw Ethereum underperforming Bitcoin, as it was treated less like a safe haven and more as a high-beta risk asset, which led to reductions in network capital commitment. The reduction in geopolitical uncertainty after the peace deal drove a notable shift in institutional flows and risk appetite towards Ethereum, further aligning its price action with global risk cycles and monetary policy exposure.
Immediate resistance with selling momentum and oversold signals
On the technical front, ETH/USD remains below the h4 MA-20 at $1,714 and the MA-50 at $1,731, with the daily MA-200 above at $2,351. The Ichimoku Kijun level offers immediate resistance at $1,707. Support is noted at $1,579, while the upper boundary for short-term price action is seen at $1,738. Momentum indicators reflect ongoing selling pressure: MACD remains in a sell configuration, and the ADX points to a neutral trend. RSI stands at 37.18, indicating weakness, while Stoch RSI, CCI, and BBP all show the asset is oversold. The Awesome Oscillator also signals a continuation of downward momentum.
Bearish scenario persists as volatility bands tighten
Over the next several days, the expected volatility band for ETH/USD is projected between $1,579 and $1,738. The likelihood of a bearish continuation remains high given the current intraday setup, with a 76% chance of further downside and only a 24% probability of a bullish reversal. A sustained move above $1,707 would be required to trigger a recovery scenario, while a close below $1,579 could signal additional losses in the near term.
Earlier, analysts noted that despite significant corporate accumulation, Ethereum continued to face downward pressure amid persistent ETF outflows and broader macroeconomic headwinds. The recent easing of geopolitical risk following the US-Iran ceasefire introduces a new variable, suggesting traders should closely monitor Ethereum’s responsiveness to shifts in global sentiment, as well as any emergence of renewed institutional inflows that could alter the prevailing bearish scenario.


-
 Afghanistan
-
 Albania
-
 Algeria
-
 Angola
-
 Argentina
-
 Armenia
-
 Australia
-
 Austria
-
 Azerbaijan
-
 Bahamas
-
 Bahrain
-
 Bangladesh
-
 Belarus
-
 Belgium
-
 Bolivia
-
 Botswana
-
 Brazil
-
 Brunei
-
 Bulgaria
-
 Cambodia
-
 Cameroon
-
 Canada
-
 Chile
Chile
-
 China
China
-
 Colombia
-
 Congo
Congo
-
 Costa Rica
-
 Cote d'Ivoire
-
 Croatia
-
 Cuba
Cuba
-
 Cyprus
-
 Czechia
-
 DR Congo
-
 Denmark
-
 Dominican Republic
-
 Ecuador
-
 Egypt
Egypt
-
 El Salvador
-
 Estonia
-
 Eswatini
-
 Ethiopia
-
 Finland
-
 France
-
 Georgia
-
 Germany
-
 Ghana
Ghana
-
 Greece
-
 Haiti
Haiti
-
 Hong Kong
-
 Hungary
-
 India
India
-
 Indonesia
-
 Iran, Islamic republic
-
 Iraq
Iraq
-
 Ireland
-
 Israel
-
 Italy
Italy
-
 Jamaica
-
 Japan
Japan
-
 Jordan
-
 Kazakhstan
-
 Kenya
Kenya
-
 Korea
Korea
-
 Kuwait
-
 Kyrgyzstan
-
 Laos
Laos
-
 Latvia
-
 Lebanon
-
 Lesotho
-
 Libya
Libya
-
 Lithuania
-
 Luxembourg
-
 Madagascar
-
 Malaysia
-
 Malta
Malta
-
 Mauritius
-
 Mexico
-
 Moldova
-
 Mongolia
-
 Montenegro
-
 Morocco
-
 Mozambique
-
 Myanmar
-
 Namibia
-
 Nepal
Nepal
-
 Netherlands
-
 New Zealand
-
 Nigeria
-
 North Macedonia
-
 Norway
-
 Oman
Oman
-
 Pakistan
-
 Palestine
-
 Panama
-
 Papua New Guinea
-
 Paraguay
-
 Peru
Peru
-
 Philippines
-
 Poland
-
 Portugal
-
 Puerto Rico
-
 Qatar
Qatar
-
 Reunion
-
 Romania
-
 Rwanda
-
 Saudi Arabia
-
 Serbia
-
 Singapore
-
 Slovakia
-
 Slovenia
-
 Somalia
-
 South Africa
-
 Spain
Spain
-
 Sri Lanka
-
 Sweden
-
 Switzerland
-
 Syria
Syria
-
 Taiwan
-
 Tajikistan
-
 Tanzania
-
 Thailand
-
 Trinidad and Tobago
-
 Tunisia
-
 Turkey
-
 UAE
UAE
-
 Uganda
-
 Ukraine
-
 United Kingdom
-
United States
-
 Uruguay
-
 Uzbekistan
-
 Venezuela
-
 Vietnam
-
 Yemen
Yemen
-
 Zambia
-
 Zimbabwe
- Forex
- Crypto
