
+5.99% for Celestia as scalable blockchain adoption expands

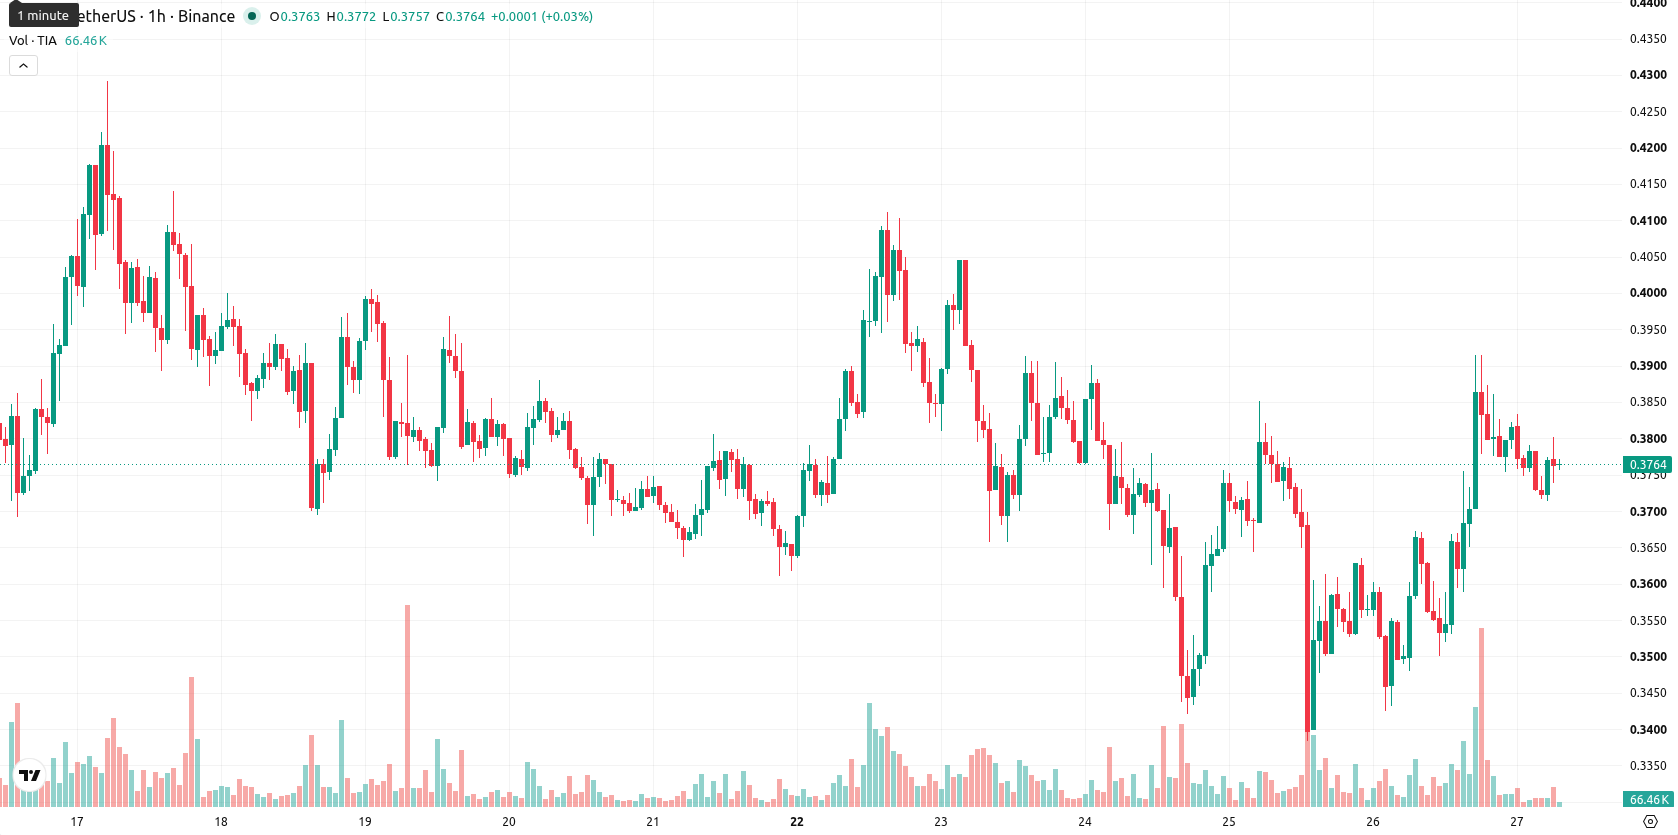
Celestia (TIA) is trading at $0.377, posting a 5.99% rise over the last 24 hours. The asset is currently positioned above its key moving averages, indicating short- and medium-term bullish momentum.
Highlights
- TIA saw trading volume surge 25% above its 30-day average, signaling heightened interest and greater liquidity.
- Market participants are increasingly focused on Celestia’s modular data availability technology, underpinning demand for scalable blockchain infrastructure.
- Technical indicators flash short-term bullish momentum despite mixed signals, with price likely to consolidate between $0.3607 and $0.3933 in the next session.
Elevated trading activity as liquidity and participation surge
Trading activity in TIA is elevated, as volume moved 25% above the 30-day average on June 26, 2026, signaling increased participation and contributing to greater intraday liquidity. This heightened trading environment allows for faster execution and can amplify both upward and downward moves, reflecting rising interest from both new and returning market participants. Underlying this activity, Celestia’s role as a modular data availability layer continues to attract attention for its ability to support scalable blockchain and rollup operations, according to Diariobitcoin.
Mixed oscillator signals as MACD buy collides with seller dominance
On the technical front, TIA/USD is situated above its MA-20 and MA-50 on the 1-hour chart, but remains below the MA-200. The Ichimoku Kijun provides immediate support at $0.3698. Among momentum readings, the Moving Average Convergence Divergence (MACD) flashes a strong buy signal, while the Average Directional Index (ADX) is neutral, implying uncertain trend strength. The Relative Strength Index (RSI) signals buy, Stochastic RSI is oversold, and the Commodity Channel Index (CCI) stands neutral, highlighting the potential for continued short-term buying but also cautioning that the asset could be approaching a local floor. Bull/Bear Power shows seller dominance with a sell signal, diverging from bullish oscillator readings, and the Awesome Oscillator remains neutral, emphasizing indecision amid the current rebound.
Range-bound consolidation seen as upside probability outweighs reversal risk
Looking ahead to the next trading day, TIA/USD is expected to fluctuate between $0.3607 and $0.3933, reflecting a moderate volatility band relative to current levels. The probability of continued upward movement is assessed as very high, while the probability of a reversal to the downside is considered low. The base scenario favors consolidation within this projected range. Should the price break above the upper resistance, a bullish extension could develop, while a move below the immediate support would open the door to a short-lived downward correction.
Earlier, analysts noted that Celestia was exhibiting emerging bullish momentum in the face of mixed technical signals and a risk of heightened volatility. The latest uptick in trading activity and evolving indicator dynamics further strengthen this outlook, making the upper resistance level a critical area for traders to monitor for confirmation of a sustained breakout.


Latest Celestia News


-
 Afghanistan
-
 Albania
-
 Algeria
-
 Angola
-
 Argentina
-
 Armenia
-
 Australia
-
 Austria
-
 Azerbaijan
-
 Bahamas
-
 Bahrain
-
 Bangladesh
-
 Belarus
-
 Belgium
-
 Bolivia
-
 Botswana
-
 Brazil
-
 Brunei
-
 Bulgaria
-
 Cambodia
-
 Cameroon
-
 Canada
-
 Chile
Chile
-
 China
China
-
 Colombia
-
 Congo
Congo
-
 Costa Rica
-
 Cote d'Ivoire
-
 Croatia
-
 Cuba
Cuba
-
 Cyprus
-
 Czechia
-
 DR Congo
-
 Denmark
-
 Dominican Republic
-
 Ecuador
-
 Egypt
Egypt
-
 El Salvador
-
 Estonia
-
 Eswatini
-
 Ethiopia
-
 Finland
-
 France
-
 Georgia
-
 Germany
-
 Ghana
Ghana
-
 Greece
-
 Haiti
Haiti
-
 Hong Kong
-
 Hungary
-
 India
India
-
 Indonesia
-
 Iran, Islamic republic
-
 Iraq
Iraq
-
 Ireland
-
 Israel
-
 Italy
Italy
-
 Jamaica
-
 Japan
Japan
-
 Jordan
-
 Kazakhstan
-
 Kenya
Kenya
-
 Korea
Korea
-
 Kuwait
-
 Kyrgyzstan
-
 Laos
Laos
-
 Latvia
-
 Lebanon
-
 Lesotho
-
 Libya
Libya
-
 Lithuania
-
 Luxembourg
-
 Madagascar
-
 Malaysia
-
 Malta
Malta
-
 Mauritius
-
 Mexico
-
 Moldova
-
 Mongolia
-
 Montenegro
-
 Morocco
-
 Mozambique
-
 Myanmar
-
 Namibia
-
 Nepal
Nepal
-
 Netherlands
-
 New Zealand
-
 Nigeria
-
 North Macedonia
-
 Norway
-
 Oman
Oman
-
 Pakistan
-
 Palestine
-
 Panama
-
 Papua New Guinea
-
 Paraguay
-
 Peru
Peru
-
 Philippines
-
 Poland
-
 Portugal
-
 Puerto Rico
-
 Qatar
Qatar
-
 Reunion
-
 Romania
-
 Rwanda
-
 Saudi Arabia
-
 Serbia
-
 Singapore
-
 Slovakia
-
 Slovenia
-
 Somalia
-
 South Africa
-
 Spain
Spain
-
 Sri Lanka
-
 Sweden
-
 Switzerland
-
 Syria
Syria
-
 Taiwan
-
 Tajikistan
-
 Tanzania
-
 Thailand
-
 Trinidad and Tobago
-
 Tunisia
-
 Turkey
-
 UAE
UAE
-
 Uganda
-
 Ukraine
-
 United Kingdom
-
United States
-
 Uruguay
-
 Uzbekistan
-
 Venezuela
-
 Vietnam
-
 Yemen
Yemen
-
 Zambia
-
 Zimbabwe
- Forex
- Crypto
