

Why is VeChain down today? Trading below key short-term levels exposes support targets

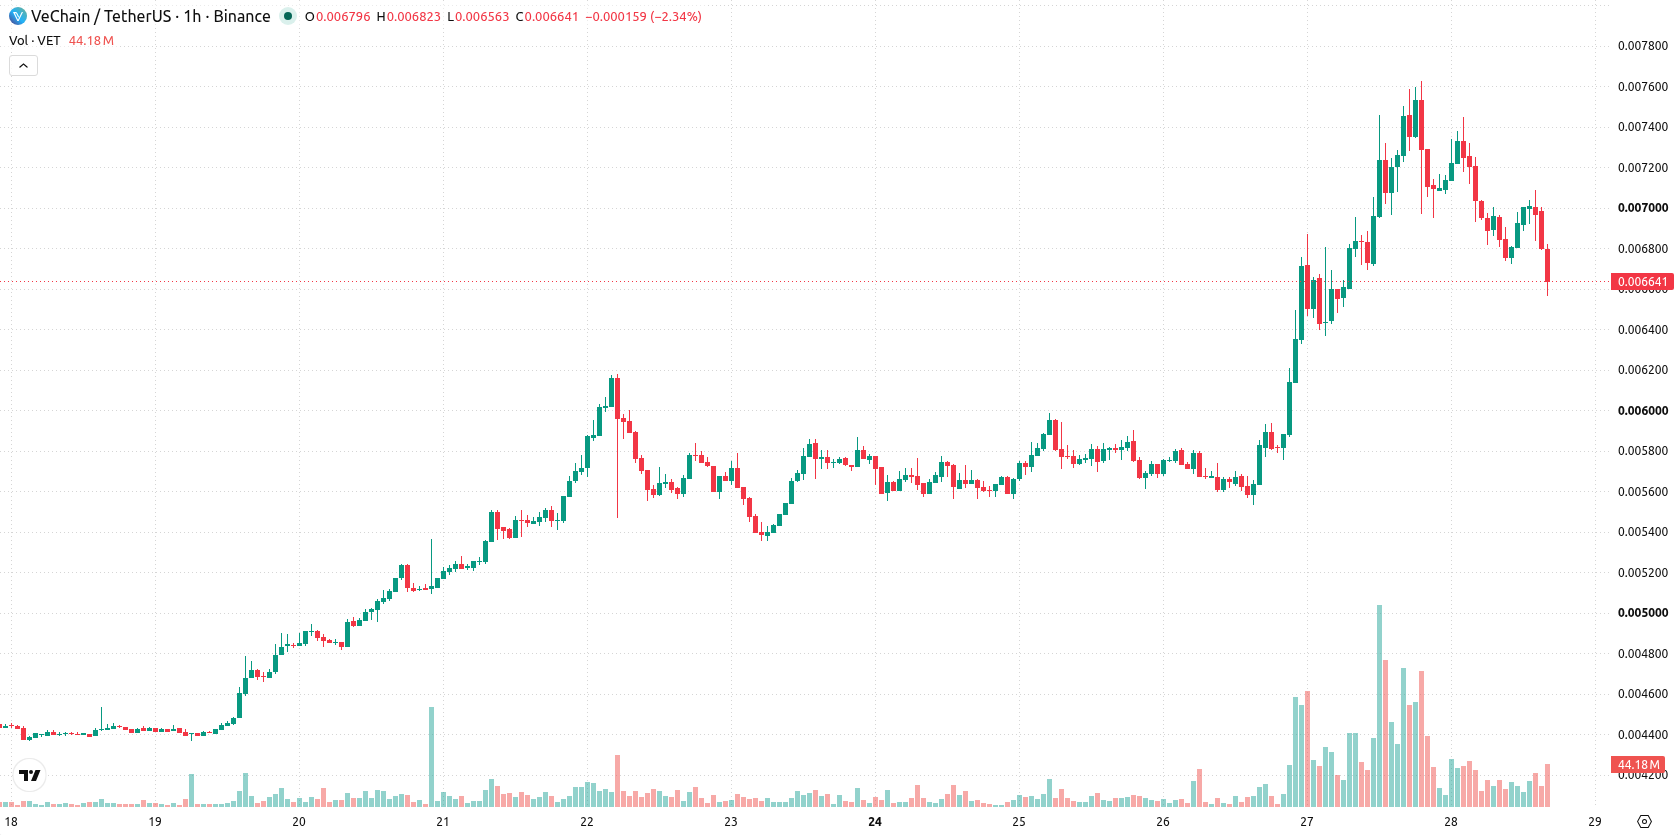
VeChain (VET) is trading at $0.006611, marking a daily decline of 11.32%. The asset is currently positioned below its key short- and medium-term moving averages, with price action reflecting intensified near-term selling pressure.
 0.007454
0.00810000
0.007454
0.00810000
Highlights
- VeChain saw a surge in spot and derivatives trading volume on August 27, 2026, boosting market liquidity and volatility.
- VET's price action continues under broad selling pressure despite large intraday swings and increased trader participation.
- VET trades below key short- and medium-term averages, with a projected range of $0.00610274 to $0.00732 and 55% probability of an upward move if resistance at $0.007176 breaks.
Amplified volatility as trading activity and liquidity surge
On August 27, 2026, VeChain experienced a notable surge in trading activity, marked by significant increases in both spot volume and derivatives participation. This elevated activity contributed to heightened liquidity and amplified intraday volatility, enabling more pronounced price movements as traders engaged in rapid repositioning. The boost in market participation has created a backdrop for larger swings in VET's valuation, though price action has remained under broader selling pressure.
Bullish momentum conflicting with mixed oscillator signals
VET/USD is currently trading below the MA-20 at $0.0070254 and the MA-50 at $0.00677076 on the hourly chart, while staying above the MA-200 at $0.00617363. The immediate resistance level is identified at the Ichimoku Kijun, set at $0.007176. On the indicator front, MACD and ADX both show strong buy signals, indicating bullish momentum, but this is contrasted by RSI at 47.94 and CCI suggesting sell conditions. Stochastic RSI presents a neutral outlook, while Bull/Bear Power indicates that buyers are gaining traction in intraday trade. Oscillators reflect a mixed technical picture, with momentum indicators pointing up even as several oscillators remain bearish.
Consolidation outlook as resistance and support define range
For the coming two to three sessions, VET/USD is expected to trade within a volatility band ranging from $0.00610274 to $0.00732. The baseline scenario is consolidation inside this range. There is a 55% probability of an upward move should buyers sustain momentum, with bullish confirmation if price breaks above resistance at $0.007176. Conversely, if support at $0.00610274 fails to hold, a move lower would become more likely, indicating further downside risk.
Earlier, analysts noted that VeChain's technical outlook was bullish amid anticipation of the Interstellar protocol upgrade and increased on-chain activity. Recent volatility and mixed technical signals now suggest traders should closely monitor the $0.007176 resistance and $0.00610274 support, as a sustained break of either could set the tone for VET's next directional move.










-
 Afghanistan
-
 Albania
-
 Algeria
-
 Angola
-
 Argentina
-
 Armenia
-
 Australia
-
 Austria
-
 Azerbaijan
-
 Bahamas
-
 Bahrain
-
 Bangladesh
-
 Belarus
-
 Belgium
-
 Bolivia
-
 Botswana
-
 Brazil
-
 Brunei
-
 Bulgaria
-
 Cambodia
-
 Cameroon
-
 Canada
-
 Chile
Chile
-
 China
China
-
 Colombia
-
 Congo
Congo
-
 Costa Rica
-
 Cote d'Ivoire
-
 Croatia
-
 Cuba
Cuba
-
 Cyprus
-
 Czechia
-
 DR Congo
-
 Denmark
-
 Dominican Republic
-
 Ecuador
-
 Egypt
Egypt
-
 El Salvador
-
 Estonia
-
 Eswatini
-
 Ethiopia
-
 Finland
-
 France
-
 Georgia
-
 Germany
-
 Ghana
Ghana
-
 Greece
-
 Haiti
Haiti
-
 Hong Kong
-
 Hungary
-
 India
India
-
 Indonesia
-
 Iran, Islamic republic
-
 Iraq
Iraq
-
 Ireland
-
 Israel
-
 Italy
Italy
-
 Jamaica
-
 Japan
Japan
-
 Jordan
-
 Kazakhstan
-
 Kenya
Kenya
-
 Korea
Korea
-
 Kuwait
-
 Kyrgyzstan
-
 Laos
Laos
-
 Latvia
-
 Lebanon
-
 Lesotho
-
 Libya
Libya
-
 Lithuania
-
 Luxembourg
-
 Madagascar
-
 Malaysia
-
 Malta
Malta
-
 Mauritius
-
 Mexico
-
 Moldova
-
 Mongolia
-
 Montenegro
-
 Morocco
-
 Mozambique
-
 Myanmar
-
 Namibia
-
 Nepal
Nepal
-
 Netherlands
-
 New Zealand
-
 Nigeria
-
 North Macedonia
-
 Norway
-
 Oman
Oman
-
 Pakistan
-
 Palestine
-
 Panama
-
 Papua New Guinea
-
 Paraguay
-
 Peru
Peru
-
 Philippines
-
 Poland
-
 Portugal
-
 Puerto Rico
-
 Qatar
Qatar
-
 Reunion
-
 Romania
-
 Rwanda
-
 Saudi Arabia
-
 Serbia
-
 Singapore
-
 Slovakia
-
 Slovenia
-
 Somalia
-
 South Africa
-
 Spain
Spain
-
 Sri Lanka
-
 Sweden
-
 Switzerland
-
 Syria
Syria
-
 Taiwan
-
 Tajikistan
-
 Tanzania
-
 Thailand
-
 Trinidad and Tobago
-
 Tunisia
-
 Turkey
-
 UAE
UAE
-
 Uganda
-
 Ukraine
-
 United Kingdom
-
United States
-
 Uruguay
-
 Uzbekistan
-
 Venezuela
-
 Vietnam
-
 Yemen
Yemen
-
 Zambia
-
 Zimbabwe
- Forex
- Crypto












