

-2.24% for Ethereum as $408 million ETH whale sell-off weighs on sentiment

Ethereum (ETH) is trading at $2,451, down 2.24% on the day, with price closing near today’s low. The asset is positioned above its key long-term moving averages but remains below some short- and intermediate-term averages, reflecting mixed trend signals.
 2522.63
2587.28
2522.63
2587.28
Highlights
- U.S. spot Ethereum ETFs saw $141.39 million in net inflows, with BlackRock and Fidelity receiving the largest allocations.
- A large wallet transferred 167,855 ETH worth $408 million to exchanges since late August, lifting available supply and potential sell pressure.
- ETH is consolidating in a $2,366 to $2,536 range, with mixed momentum signals and sellers dominating intraday moves.
ETF inflow offsets whale supply as institutional exposure increases
U.S. spot Ethereum ETFs recorded a net inflow of $141.39 million on September 3, with BlackRock’s ETHA and Fidelity’s FETH drawing the largest commitments, according to Kucoin. This influx of institutional assets into exchange-traded funds increases regulated exposure to ETH, supporting overall market liquidity from traditional investment channels. Alongside this, News Bitcoin reported that a mystery whale moved 167,855 ETH, valued at $408 million, onto exchanges since late August, adding significant supply and increasing potential sell-side pressure.
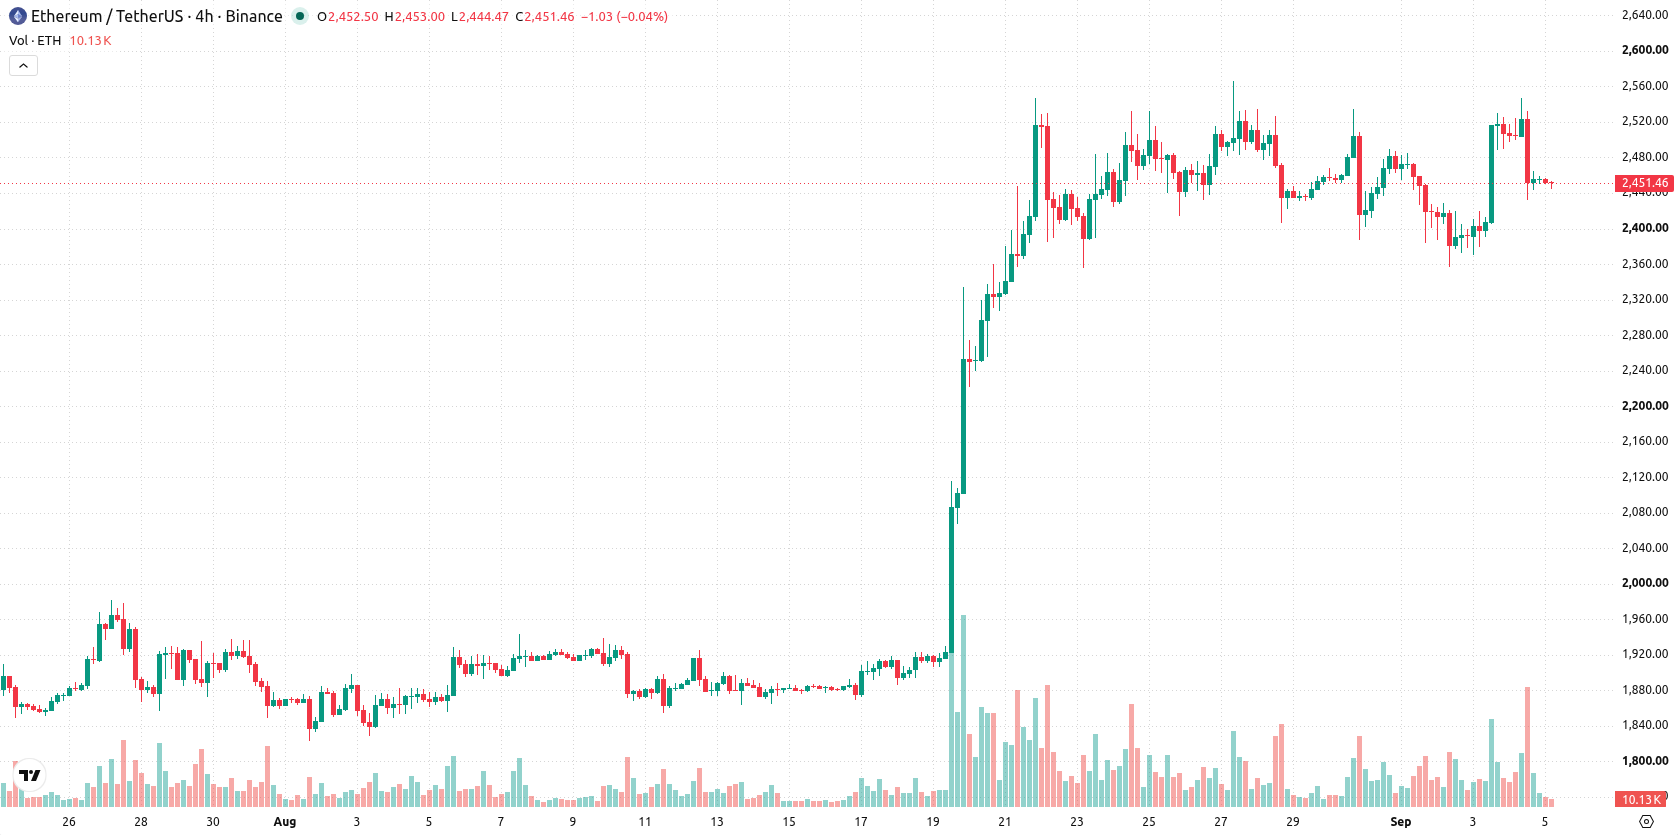
Resistance at Kijun and mixed momentum signal trader indecision
On the technical front, ETH is currently trading above the MA-20 but just below the MA-50 on the 4-hour chart, maintaining a clear margin above the MA-200 on the daily timeframe. The Ichimoku Kijun at $2,451 now defines immediate resistance, and price remains near this level after a $51 gap was left intraday. Indicator readings are mixed: MACD is in strong buy territory, while ADX is neutral; RSI shows a weak sell signal, and both Stoch RSI and CCI are neutral, showing no clear overbought or oversold conditions. Bull/Bear Power confirms that sellers dominate on intraday frames, and the Awesome Oscillator is neutral, reinforcing the current trader indecision.
Sideways trading likely as resistance cluster limits breakout odds
For the short term, ETH is expected to trade within a $2,366 to $2,536 band, capturing its typical volatility. There is a 56% probability of an upward move within this range, while a decline is less likely at 44%. The base case is for further sideways action; a bullish breakout requires price to move decisively above both the Kijun and MA-50 resistance cluster, while a drop below $2,366 would likely trigger renewed bearish momentum.
Previously it was reported that UK retail investors gained broader access to regulated crypto-linked products as major platforms began offering bitcoin and ether exchange-traded notes following regulatory shifts. This expansion of regulated participation is now echoed by substantial institutional inflows into U.S. spot Ethereum ETFs, highlighting $2,366 as a critical support level to watch for potential downside risk in the near term.





Latest Ethereum News






-
 Afghanistan
-
 Albania
-
 Algeria
-
 Angola
-
 Argentina
-
 Armenia
-
 Australia
-
 Austria
-
 Azerbaijan
-
 Bahamas
-
 Bahrain
-
 Bangladesh
-
 Belarus
-
 Belgium
-
 Bolivia
-
 Botswana
-
 Brazil
-
 Brunei
-
 Bulgaria
-
 Cambodia
-
 Cameroon
-
 Canada
-
 Chile
Chile
-
 China
China
-
 Colombia
-
 Congo
Congo
-
 Costa Rica
-
 Cote d'Ivoire
-
 Croatia
-
 Cuba
Cuba
-
 Cyprus
-
 Czechia
-
 DR Congo
-
 Denmark
-
 Dominican Republic
-
 Ecuador
-
 Egypt
Egypt
-
 El Salvador
-
 Estonia
-
 Eswatini
-
 Ethiopia
-
 Finland
-
 France
-
 Georgia
-
 Germany
-
 Ghana
Ghana
-
 Greece
-
 Haiti
Haiti
-
 Hong Kong
-
 Hungary
-
 India
India
-
 Indonesia
-
 Iran, Islamic republic
-
 Iraq
Iraq
-
 Ireland
-
 Israel
-
 Italy
Italy
-
 Jamaica
-
 Japan
Japan
-
 Jordan
-
 Kazakhstan
-
 Kenya
Kenya
-
 Korea
Korea
-
 Kuwait
-
 Kyrgyzstan
-
 Laos
Laos
-
 Latvia
-
 Lebanon
-
 Lesotho
-
 Libya
Libya
-
 Lithuania
-
 Luxembourg
-
 Madagascar
-
 Malaysia
-
 Malta
Malta
-
 Mauritius
-
 Mexico
-
 Moldova
-
 Mongolia
-
 Montenegro
-
 Morocco
-
 Mozambique
-
 Myanmar
-
 Namibia
-
 Nepal
Nepal
-
 Netherlands
-
 New Zealand
-
 Nigeria
-
 North Macedonia
-
 Norway
-
 Oman
Oman
-
 Pakistan
-
 Palestine
-
 Panama
-
 Papua New Guinea
-
 Paraguay
-
 Peru
Peru
-
 Philippines
-
 Poland
-
 Portugal
-
 Puerto Rico
-
 Qatar
Qatar
-
 Reunion
-
 Romania
-
 Rwanda
-
 Saudi Arabia
-
 Serbia
-
 Singapore
-
 Slovakia
-
 Slovenia
-
 Somalia
-
 South Africa
-
 Spain
Spain
-
 Sri Lanka
-
 Sweden
-
 Switzerland
-
 Syria
Syria
-
 Taiwan
-
 Tajikistan
-
 Tanzania
-
 Thailand
-
 Trinidad and Tobago
-
 Tunisia
-
 Turkey
-
 UAE
UAE
-
 Uganda
-
 Ukraine
-
 United Kingdom
-
United States
-
 Uruguay
-
 Uzbekistan
-
 Venezuela
-
 Vietnam
-
 Yemen
Yemen
-
 Zambia
-
 Zimbabwe
- Forex
- Crypto












