

Whale sale of 167,855 ETH weighs on Ethereum price below $2,401 support

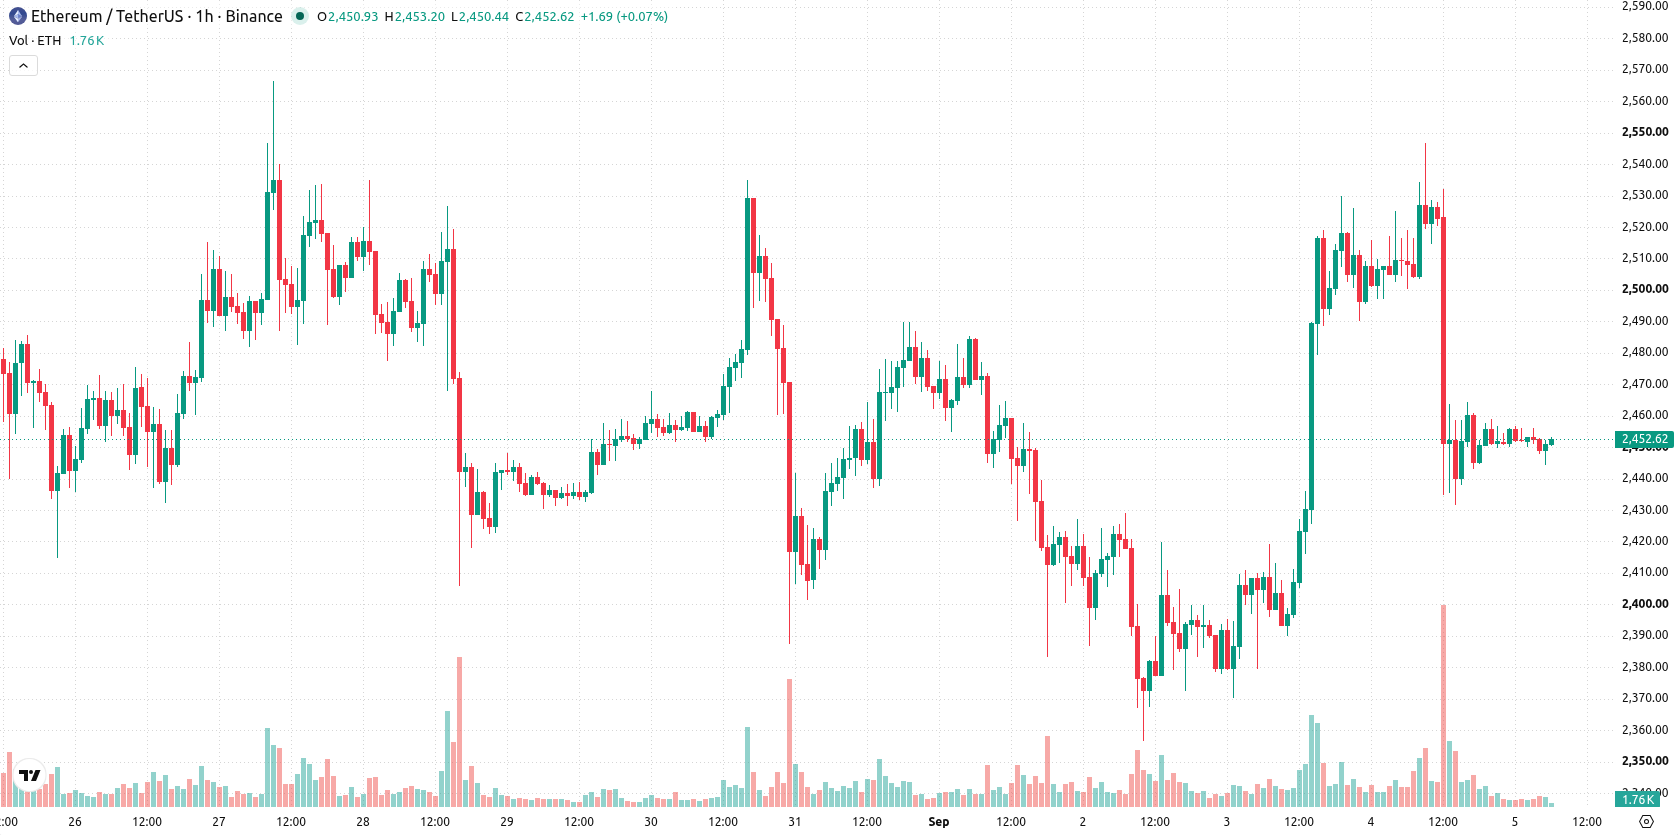
Ethereum (ETH) is trading at $2,451, down 2.37% for the day. The asset is positioned below its key short- and mid-term moving averages, signaling selling momentum on these timeframes.
 2538.52
2699.80
2538.52
2699.80
Highlights
- An Ethereum whale sold 167,855 ETH worth $408 million since late August, adding significant supply to the market.
- U.S. spot Ethereum ETFs saw large net inflows of $26.46 million and $141 million on September 4 and 3, indicating strong institutional demand.
- ETH/USD trades below key moving averages with bearish technical signals and is expected to fluctuate between $2,401 and $2,522 over the next 2 to 3 days.
Whale selling and ETF inflows reshape supply-demand balance
A major Ethereum whale sold 167,855 ETH valued at $408 million since late August, contributing significant additional supply to the market and potentially amplifying selling pressure. Recent days also witnessed robust net inflows into U.S. spot Ethereum ETFs, with $26.46 million and $141 million reported on September 4 and September 3, respectively, by Cryptobriefing, channeling institutional demand that may have partially offset market supply. Meanwhile, Ethereum's OLY project has launched its Mint Phase, incentivizing user participation on-chain through a tiered, daily-increasing price schedule. These events highlight notable shifts in supply and demand, though price action has remained under broader selling pressure.
Bearish signals and mixed momentum as ETH holds critical support
Technically, ETH is trading below the MA-20 and MA-50 on the 1-hour chart but remains above the MA-200 on the daily timeframe. Immediate resistance is identified at the Ichimoku Kijun level of $2,489, with support at $2,401 providing a key floor. Indicator readings paint a mostly bearish profile: MACD shows a sell signal, while ADX remains neutral, suggesting the trend lacks conviction. RSI stands at 41.74 and CCI is also signaling a sell, but both Stochastic RSI and the Awesome Oscillator are neutral, implying some near-term indecision. Bull/Bear Power confirms sellers remain in control with indications of oversold conditions; however, divergent signals from Stochastic RSI and ADX highlight mixed intraday sentiment.
Consolidation likely as breakout depends on key resistance and support
For the next 2–3 trading days, ETH/USD is expected to consolidate between $2,401 and $2,522, reflecting a typical volatility band relative to current levels. There is a 26% probability of an upward breakout, while a deeper decline is more likely if price slides below $2,401 support. A bullish scenario would require a firm move above $2,489 resistance, whereas sustained pressure below support could trigger downside extension.
Earlier, analysts noted that Ethereum was likely to continue trading in a sideways range as mixed technical factors and institutional inflows balanced out increased market supply. The latest market developments reinforce this view, with near-term consolidation expected between $2,401 and $2,522 as traders monitor for a decisive break of support or resistance.





Latest Ethereum News





-
 Afghanistan
-
 Albania
-
 Algeria
-
 Angola
-
 Argentina
-
 Armenia
-
 Australia
-
 Austria
-
 Azerbaijan
-
 Bahamas
-
 Bahrain
-
 Bangladesh
-
 Belarus
-
 Belgium
-
 Bolivia
-
 Botswana
-
 Brazil
-
 Brunei
-
 Bulgaria
-
 Cambodia
-
 Cameroon
-
 Canada
-
 Chile
Chile
-
 China
China
-
 Colombia
-
 Congo
Congo
-
 Costa Rica
-
 Cote d'Ivoire
-
 Croatia
-
 Cuba
Cuba
-
 Cyprus
-
 Czechia
-
 DR Congo
-
 Denmark
-
 Dominican Republic
-
 Ecuador
-
 Egypt
Egypt
-
 El Salvador
-
 Estonia
-
 Eswatini
-
 Ethiopia
-
 Finland
-
 France
-
 Georgia
-
 Germany
-
 Ghana
Ghana
-
 Greece
-
 Haiti
Haiti
-
 Hong Kong
-
 Hungary
-
 India
India
-
 Indonesia
-
 Iran, Islamic republic
-
 Iraq
Iraq
-
 Ireland
-
 Israel
-
 Italy
Italy
-
 Jamaica
-
 Japan
Japan
-
 Jordan
-
 Kazakhstan
-
 Kenya
Kenya
-
 Korea
Korea
-
 Kuwait
-
 Kyrgyzstan
-
 Laos
Laos
-
 Latvia
-
 Lebanon
-
 Lesotho
-
 Libya
Libya
-
 Lithuania
-
 Luxembourg
-
 Madagascar
-
 Malaysia
-
 Malta
Malta
-
 Mauritius
-
 Mexico
-
 Moldova
-
 Mongolia
-
 Montenegro
-
 Morocco
-
 Mozambique
-
 Myanmar
-
 Namibia
-
 Nepal
Nepal
-
 Netherlands
-
 New Zealand
-
 Nigeria
-
 North Macedonia
-
 Norway
-
 Oman
Oman
-
 Pakistan
-
 Palestine
-
 Panama
-
 Papua New Guinea
-
 Paraguay
-
 Peru
Peru
-
 Philippines
-
 Poland
-
 Portugal
-
 Puerto Rico
-
 Qatar
Qatar
-
 Reunion
-
 Romania
-
 Rwanda
-
 Saudi Arabia
-
 Serbia
-
 Singapore
-
 Slovakia
-
 Slovenia
-
 Somalia
-
 South Africa
-
 Spain
Spain
-
 Sri Lanka
-
 Sweden
-
 Switzerland
-
 Syria
Syria
-
 Taiwan
-
 Tajikistan
-
 Tanzania
-
 Thailand
-
 Trinidad and Tobago
-
 Tunisia
-
 Turkey
-
 UAE
UAE
-
 Uganda
-
 Ukraine
-
 United Kingdom
-
United States
-
 Uruguay
-
 Uzbekistan
-
 Venezuela
-
 Vietnam
-
 Yemen
Yemen
-
 Zambia
-
 Zimbabwe
- Forex
- Crypto












