

Raydium technical analysis: Rally approaches $1.73 resistance

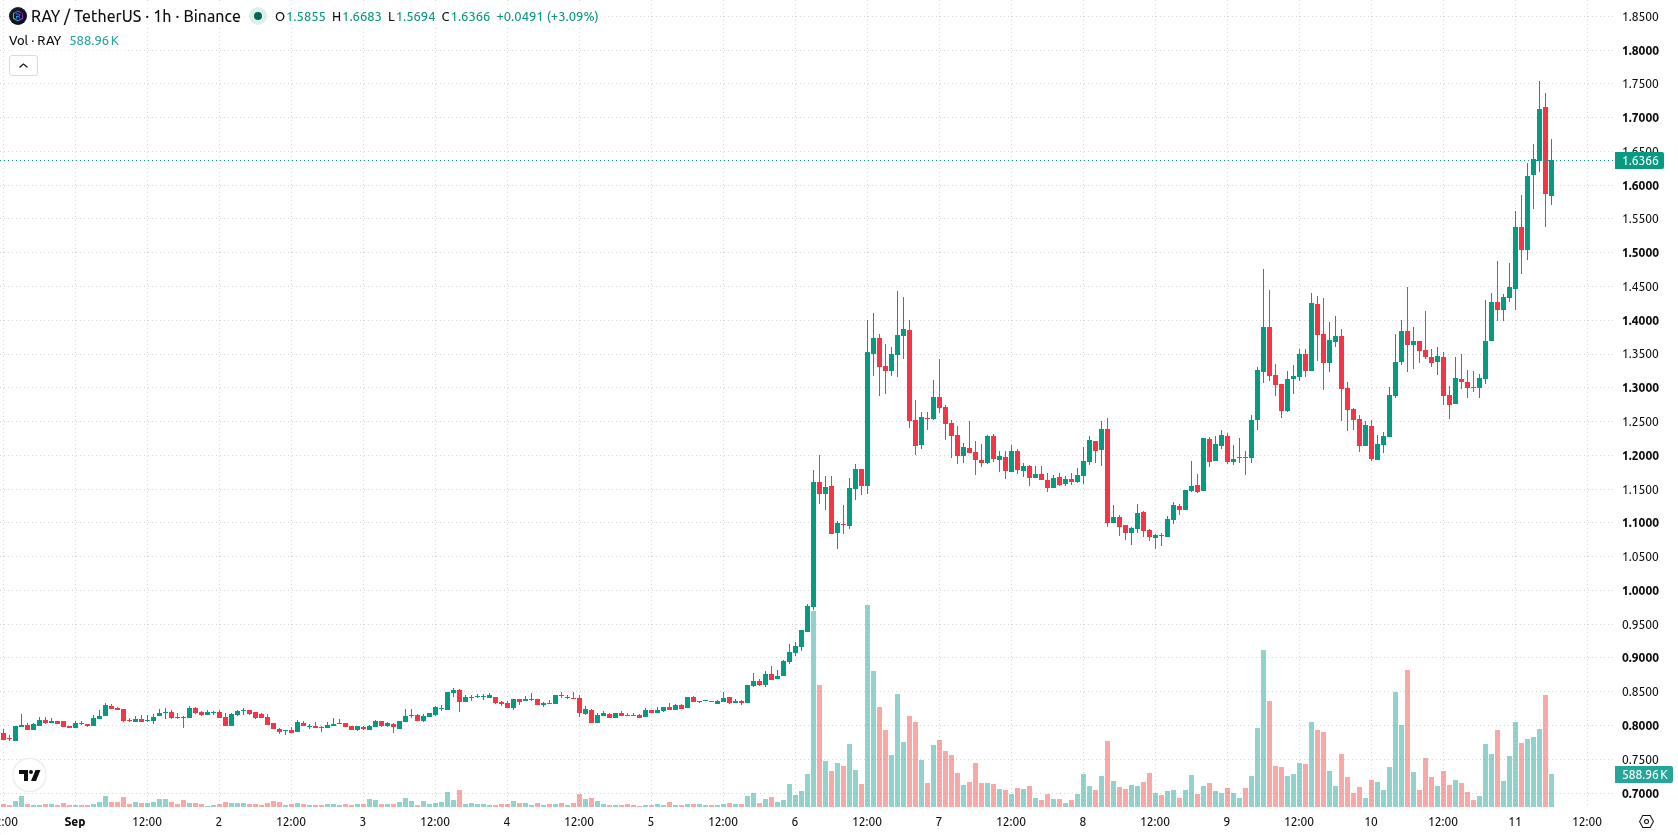
Raydium (RAY) is trading at $1.58, rallying 12.44% for the day. The asset holds above its key moving averages, reflecting strong intraday momentum.
 2.0868
2.5300
2.0868
2.5300
Highlights
- Raydium completed its largest daily buyback in 19 months with $640,000 in RAY tokens repurchased, bringing cumulative buybacks to $2.1 million.
- RAY trading volume spiked to 442% above the 30-day average during a period of accumulation driven by elevated DeFi activity.
- Technical signals confirm a strong bullish trend, with price seen consolidating between $1.4312 and $1.73 over the next two to three days.
Token buyback and surging volumes drive scarcity and demand
Raydium completed its largest daily RAY token buyback in 19 months on September 9, 2026, repurchasing approximately $640,000 worth of tokens and raising its cumulative buybacks to $2.1 million, according to Fxstreet. This substantial buyback directly reduced circulating supply, increasing scarcity and providing immediate support for the asset amid renewed buying interest. The buyback coincided with a sharp surge in trading activity, as volumes spiked to 442% above the 30-day average during a period of accumulation driven by heightened DeFi activity, as reported by Diariobitcoin. Elevated exchange participation and the recent multi-fold increase in volume further underline robust demand for RAY in a favorable market environment.
Overbought signals intensify as RAY extends gains above key supports
On the technical front, RAY trades above its MA-20 at $1.43 and MA-50 at $1.36 on the hourly chart, while also maintaining a wide margin over the MA-200 at $0.68 on the daily timeframe. The Ichimoku Kijun support sits at $1.50, acting as a critical near-term floor for the current move. Momentum indicators are strongly positive, with MACD and ADX both signaling buy, while RSI stands at 80.16, indicating overbought conditions. Stoch RSI and CCI also confirm the overbought state, and Bull/Bear Power highlights dominant buying pressure, all reinforced by a bullish signal from the Awesome Oscillator. No significant divergences are present.
Bullish consolidation anticipated amid high breakout and reversal risks
Over the next two to three trading days, RAY is expected to move within a volatility band of $1.43 to $1.73. The likelihood of continued upward movement is 75%, with a less probable 25% chance of a correction. The baseline scenario anticipates price consolidating between support at $1.50 and resistance at $1.73. A bullish breakout above $1.73 could see fresh highs, while a bearish reversal below the $1.50 Kijun support would open the door to further pullbacks.
Previously it was reported that Raydium demonstrated a strong bullish trend supported by robust on-chain activity and persistent momentum. The latest surge in buying volume and the record token buyback further reinforce this uptrend, making a potential breakout above the $1.73 resistance level a key development to monitor in the coming days.





Latest Raydium News




-
 Afghanistan
-
 Albania
-
 Algeria
-
 Angola
-
 Argentina
-
 Armenia
-
 Australia
-
 Austria
-
 Azerbaijan
-
 Bahamas
-
 Bahrain
-
 Bangladesh
-
 Belarus
-
 Belgium
-
 Bolivia
-
 Botswana
-
 Brazil
-
 Brunei
-
 Bulgaria
-
 Cambodia
-
 Cameroon
-
 Canada
-
 Chile
Chile
-
 China
China
-
 Colombia
-
 Congo
Congo
-
 Costa Rica
-
 Cote d'Ivoire
-
 Croatia
-
 Cuba
Cuba
-
 Cyprus
-
 Czechia
-
 DR Congo
-
 Denmark
-
 Dominican Republic
-
 Ecuador
-
 Egypt
Egypt
-
 El Salvador
-
 Estonia
-
 Eswatini
-
 Ethiopia
-
 Finland
-
 France
-
 Georgia
-
 Germany
-
 Ghana
Ghana
-
 Greece
-
 Haiti
Haiti
-
 Hong Kong
-
 Hungary
-
 India
India
-
 Indonesia
-
 Iran, Islamic republic
-
 Iraq
Iraq
-
 Ireland
-
 Israel
-
 Italy
Italy
-
 Jamaica
-
 Japan
Japan
-
 Jordan
-
 Kazakhstan
-
 Kenya
Kenya
-
 Korea
Korea
-
 Kuwait
-
 Kyrgyzstan
-
 Laos
Laos
-
 Latvia
-
 Lebanon
-
 Lesotho
-
 Libya
Libya
-
 Lithuania
-
 Luxembourg
-
 Madagascar
-
 Malaysia
-
 Malta
Malta
-
 Mauritius
-
 Mexico
-
 Moldova
-
 Mongolia
-
 Montenegro
-
 Morocco
-
 Mozambique
-
 Myanmar
-
 Namibia
-
 Nepal
Nepal
-
 Netherlands
-
 New Zealand
-
 Nigeria
-
 North Macedonia
-
 Norway
-
 Oman
Oman
-
 Pakistan
-
 Palestine
-
 Panama
-
 Papua New Guinea
-
 Paraguay
-
 Peru
Peru
-
 Philippines
-
 Poland
-
 Portugal
-
 Puerto Rico
-
 Qatar
Qatar
-
 Reunion
-
 Romania
-
 Rwanda
-
 Saudi Arabia
-
 Serbia
-
 Singapore
-
 Slovakia
-
 Slovenia
-
 Somalia
-
 South Africa
-
 Spain
Spain
-
 Sri Lanka
-
 Sweden
-
 Switzerland
-
 Syria
Syria
-
 Taiwan
-
 Tajikistan
-
 Tanzania
-
 Thailand
-
 Trinidad and Tobago
-
 Tunisia
-
 Turkey
-
 UAE
UAE
-
 Uganda
-
 Ukraine
-
 United Kingdom
-
United States
-
 Uruguay
-
 Uzbekistan
-
 Venezuela
-
 Vietnam
-
 Yemen
Yemen
-
 Zambia
-
 Zimbabwe
- Forex
- Crypto












