

Pendle technical analysis: Support pressure builds at $2.2788 as downside persists

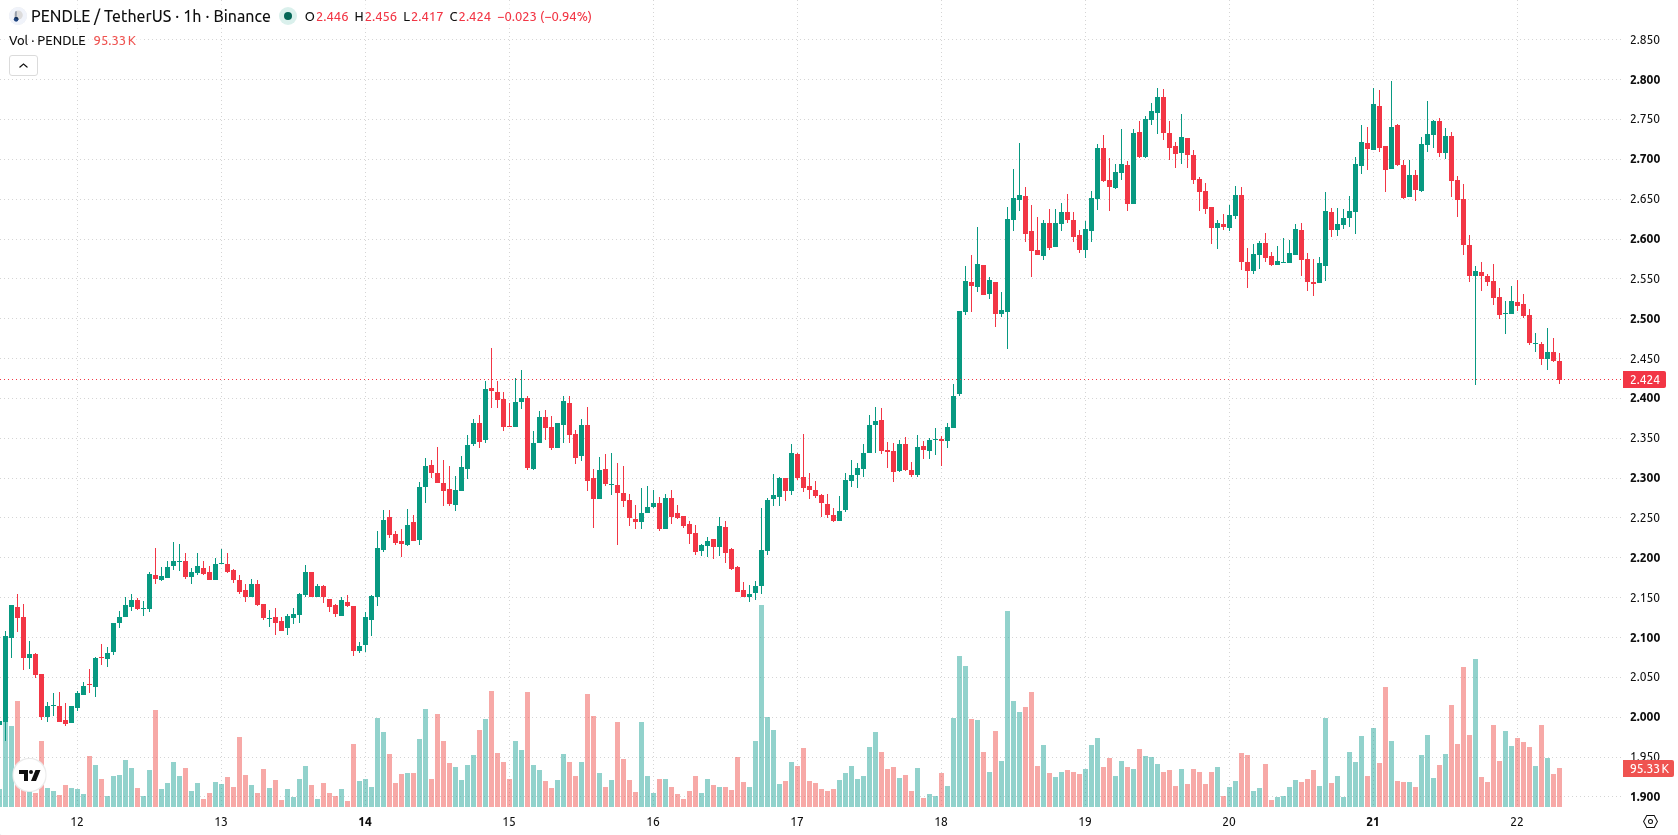
Pendle (PENDLE) is trading at $2.425, down 8.94% on the day and closing near the session's low. The asset currently sits below its key short- and medium-term moving averages, while maintaining a position well above the long-term trend indicator.
 1.764
2.0400
Highlights
- Pendle directs up to 80% of protocol revenue to PENDLE token buybacks, with the buyback rate ten times the pace of new token issuance.
- Token emissions have dropped 93% and liquidity depth increased by 40%, improving structural support and trading conditions.
- PENDLE trades under short- and medium-term selling pressure, with a high probability of further declines within the $2.2788 to $2.5712 range.
Token supply tightens as aggressive buybacks face selling pressure
Pendle's protocol has directed up to 80% of its revenue toward open-market buybacks of PENDLE tokens, with the buyback rate reportedly ten times the rate of new token issuance, according to Cryptobriefing. This direct intervention significantly limits circulating supply and would ordinarily act as a mechanical support for token value. Additional measures include a 93% reduction in token emissions and a 40% rise in liquidity depth, both of which structurally improve trading conditions. Recent platform developments, such as the launch of RWAfi for access to traditional finance yields, a dynamic fee model on PT Looping, and the rollout of NGI+ token markets, further demonstrate an expanding ecosystem, as reported by Coinfomania and Cryptobriefing — though price action has remained under broader selling pressure.
Oversold signals intensify as technical resistance caps recovery
On the hourly chart, PENDLE is trading below the MA-20 and MA-50, while maintaining a position above the MA-200. The Ichimoku Kijun provides immediate resistance at $2.5945. Oscillator readings highlight strong downside momentum: MACD and ADX both point to notable selling pressure, with the RSI at 29.45, well into oversold territory. Stochastic RSI and CCI also confirm this oversold state. Bull/Bear Power remains negative and the Awesome Oscillator continues to follow the downtrend.
Volatility persists as downside risk outweighs rebound odds
In the near term, PENDLE is expected to trade within a highly volatile range from $2.2788 to $2.5712 over the next two to three sessions. The probability of continued downside is very high, while the odds of a sustained rebound are low barring a breakout above $2.5945 resistance. The baseline scenario is for price to consolidate sideways within this corridor. A bearish scenario would be triggered by a break below $2.2788, while a bullish reversal would require a clear move through the upper band.
Earlier, analysts noted that Pendle's expanding product lineup and protocol enhancements were being overshadowed by persistent technical pressures and downside risks. The current analysis reinforces this bearish outlook with fresh evidence of strong selling momentum, highlighting $2.2788 as the critical level traders should monitor for further downside continuation or potential stabilization.










-
 Afghanistan
-
 Albania
-
 Algeria
-
 Angola
-
 Argentina
-
 Armenia
-
 Australia
-
 Austria
-
 Azerbaijan
-
 Bahamas
-
 Bahrain
-
 Bangladesh
-
 Belarus
-
 Belgium
-
 Bolivia
-
 Botswana
-
 Brazil
-
 Brunei
-
 Bulgaria
-
 Cambodia
-
 Cameroon
-
 Canada
-
 Chile
-
 China
-
 Colombia
-
 Congo
-
 Costa Rica
-
 Cote d'Ivoire
-
 Croatia
-
 Cuba
-
 Cyprus
-
 Czechia
-
 DR Congo
-
 Denmark
-
 Dominican Republic
-
 Ecuador
-
 Egypt
-
 El Salvador
-
 Estonia
-
 Eswatini
-
 Ethiopia
-
 Finland
-
 France
-
 Georgia
-
 Germany
-
 Ghana
-
 Greece
-
 Haiti
-
 Hong Kong
-
 Hungary
-
 India
-
 Indonesia
-
 Iran, Islamic republic
-
 Iraq
-
 Ireland
-
 Israel
-
 Italy
-
 Jamaica
-
 Japan
-
 Jordan
-
 Kazakhstan
-
 Kenya
-
 Korea
-
 Kuwait
-
 Kyrgyzstan
-
 Laos
-
 Latvia
-
 Lebanon
-
 Lesotho
-
 Libya
-
 Lithuania
-
 Luxembourg
-
 Madagascar
-
 Malaysia
-
 Malta
-
 Mauritius
-
 Mexico
-
 Moldova
-
 Mongolia
-
 Montenegro
-
 Morocco
-
 Mozambique
-
 Myanmar
-
 Namibia
-
 Nepal
-
 Netherlands
-
 New Zealand
-
 Nigeria
-
 North Macedonia
-
 Norway
-
 Oman
-
 Pakistan
-
 Palestine
-
 Panama
-
 Papua New Guinea
-
 Paraguay
-
 Peru
-
 Philippines
-
 Poland
-
 Portugal
-
 Puerto Rico
-
 Qatar
-
 Reunion
-
 Romania
-
 Rwanda
-
 Saudi Arabia
-
 Serbia
-
 Singapore
-
 Slovakia
-
 Slovenia
-
 Somalia
-
 South Africa
-
 Spain
-
 Sri Lanka
-
 Sweden
-
 Switzerland
-
 Syria
-
 Taiwan
-
 Tajikistan
-
 Tanzania
-
 Thailand
-
 Trinidad and Tobago
-
 Tunisia
-
 Turkey
-
 UAE
-
 Uganda
-
 Ukraine
-
 United Kingdom
-
United States
-
 Uruguay
-
 Uzbekistan
-
 Venezuela
-
 Vietnam
-
 Yemen
-
 Zambia
-
 Zimbabwe
- Forex
- Crypto












