
Solana nears breakout as price holds above $193 with bullish signals from spot and derivatives

Solana (SOL) is trading near $193.39 at the time of writing, gaining 2.48% on the day and pushing toward the upper boundary of a long-standing symmetrical triangle pattern. The asset recently reclaimed key levels near $179 and continues to find support above the 20-day exponential moving average, currently at $178.65.
Highlights
- Solana trades near $193.39, up 2.48%, approaching key resistance around $200
- Open interest jumps 5.07% to $11.33B, with options volume rising 148% amid strong long positioning
- Positive net inflow of $10.88M on July 28 signals renewed investor interest across spot markets
Technical momentum remains strong, with the Relative Strength Index (RSI) at 67.54 and price action positioned just below critical resistance near $200. Since breaking out from a descending channel in June, SOL has built a series of higher lows, while major EMAs (20, 50, 100, 200) have flipped to support.
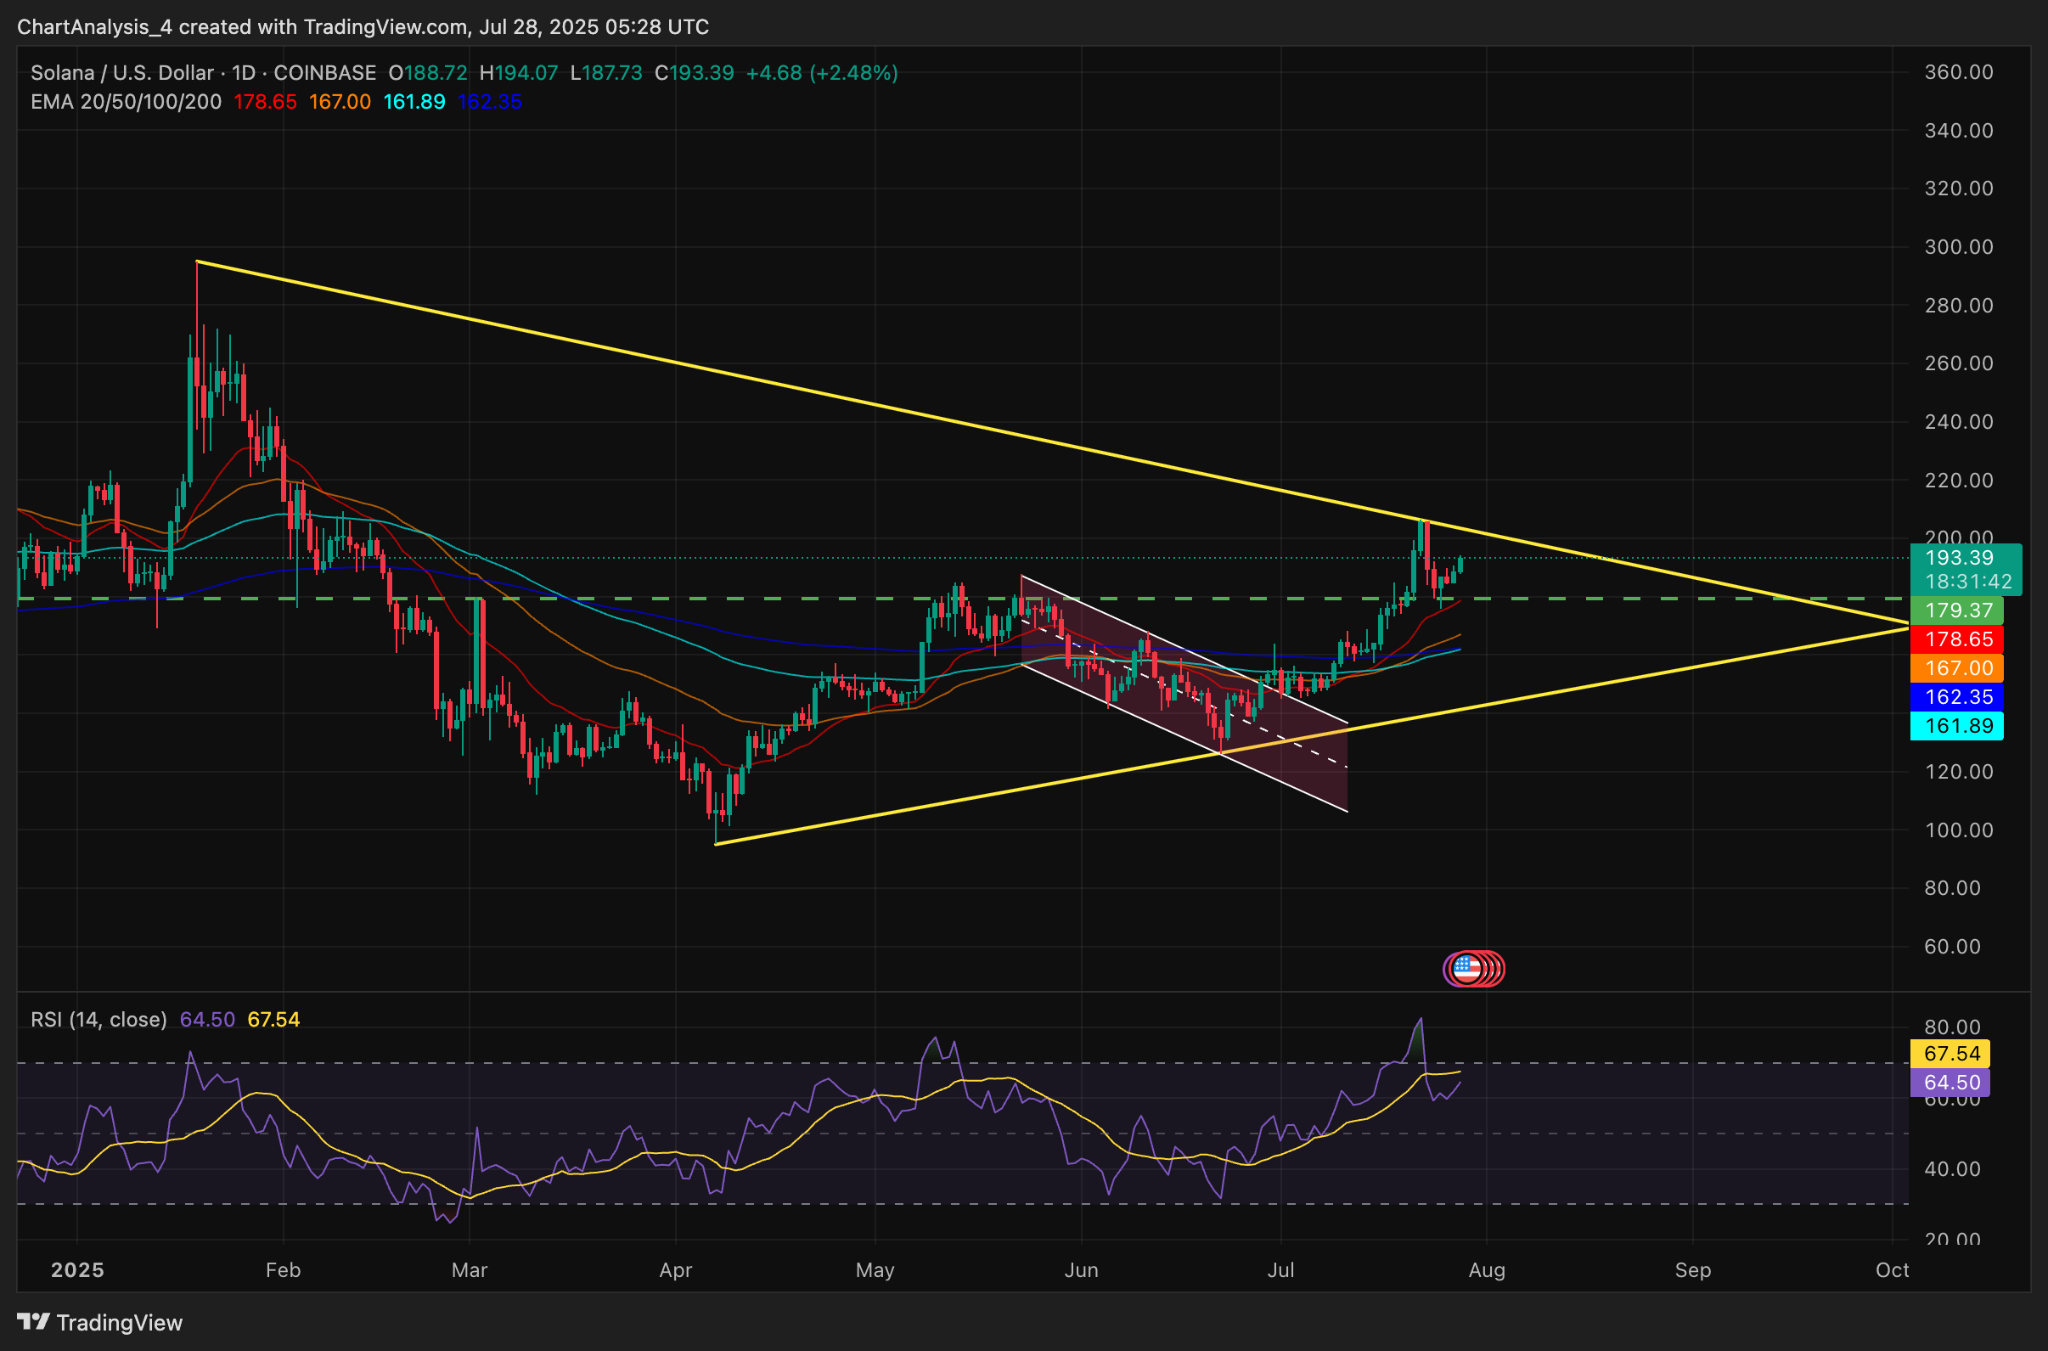
SOL price dynamics (Source: TradingView)
The structure suggests bullish continuation if Solana can clear the triangle’s upper resistance. A confirmed breakout could open the path toward $210–$220 in the near term.
Derivatives and on-chain metrics reinforce bullish setup
Derivatives data echo the optimism seen on charts. Open interest rose 5.07% to $11.33 billion, while options volume spiked 148%, indicating renewed speculative positioning. Binance’s long-short ratio stands at 3.0783 (accounts) and 2.8436 (positions), showing strong bias toward longs among top traders. Liquidation data show a $8.80 million 24-hour total, largely shorts, suggesting price increases are being met with light forced covering rather than overleverage.
On-chain, Solana saw a spot net inflow of $10.88 million on July 28, reversing a prolonged trend of outflows. Such behavior typically reflects reduced selling pressure and greater investor accumulation, especially when paired with strong derivatives activity.
In earlier Solana analysis, we highlighted the approaching triangle apex and emphasized the importance of the $178–$180 region for bulls. That zone now acts as dynamic support, with SOL attempting a breakout toward the $200 mark. A sustained close above this level could confirm the next leg higher, while failure may see the asset revert toward the $167–$170 support band.


-
 Afghanistan
-
 Albania
-
 Algeria
-
 Angola
-
 Argentina
-
 Armenia
-
 Australia
-
 Austria
-
 Azerbaijan
-
 Bahamas
-
 Bahrain
-
 Bangladesh
-
 Belarus
-
 Belgium
-
 Bolivia
-
 Botswana
-
 Brazil
-
 Brunei
-
 Bulgaria
-
 Cambodia
-
 Cameroon
-
 Canada
-
 Chile
Chile
-
 China
China
-
 Colombia
-
 Congo
Congo
-
 Costa Rica
-
 Cote d'Ivoire
-
 Croatia
-
 Cuba
Cuba
-
 Cyprus
-
 Czechia
-
 DR Congo
-
 Denmark
-
 Dominican Republic
-
 Ecuador
-
 Egypt
Egypt
-
 El Salvador
-
 Estonia
-
 Eswatini
-
 Ethiopia
-
 Finland
-
 France
-
 Georgia
-
 Germany
-
 Ghana
Ghana
-
 Greece
-
 Haiti
Haiti
-
 Hong Kong
-
 Hungary
-
 India
India
-
 Indonesia
-
 Iran, Islamic republic
-
 Iraq
Iraq
-
 Ireland
-
 Israel
-
 Italy
Italy
-
 Jamaica
-
 Japan
Japan
-
 Jordan
-
 Kazakhstan
-
 Kenya
Kenya
-
 Korea
Korea
-
 Kuwait
-
 Kyrgyzstan
-
 Laos
Laos
-
 Latvia
-
 Lebanon
-
 Lesotho
-
 Libya
Libya
-
 Lithuania
-
 Luxembourg
-
 Madagascar
-
 Malaysia
-
 Malta
Malta
-
 Mauritius
-
 Mexico
-
 Moldova
-
 Mongolia
-
 Montenegro
-
 Morocco
-
 Mozambique
-
 Myanmar
-
 Namibia
-
 Nepal
Nepal
-
 Netherlands
-
 New Zealand
-
 Nigeria
-
 North Macedonia
-
 Norway
-
 Oman
Oman
-
 Pakistan
-
 Palestine
-
 Panama
-
 Papua New Guinea
-
 Paraguay
-
 Peru
Peru
-
 Philippines
-
 Poland
-
 Portugal
-
 Puerto Rico
-
 Qatar
Qatar
-
 Reunion
-
 Romania
-
 Rwanda
-
 Saudi Arabia
-
 Serbia
-
 Singapore
-
 Slovakia
-
 Slovenia
-
 Somalia
-
 South Africa
-
 Spain
Spain
-
 Sri Lanka
-
 Sweden
-
 Switzerland
-
 Syria
Syria
-
 Taiwan
-
 Tajikistan
-
 Tanzania
-
 Thailand
-
 Trinidad and Tobago
-
 Tunisia
-
 Turkey
-
 UAE
UAE
-
 Uganda
-
 Ukraine
-
 United Kingdom
-
United States
-
 Uruguay
-
 Uzbekistan
-
 Venezuela
-
 Vietnam
-
 Yemen
Yemen
-
 Zambia
-
 Zimbabwe
- Forex
- Crypto
