
Toncoin price consolidates above key support as buyers defend rising base

Toncoin is easing from last week’s rally but remains technically constructive, with price testing layered support after retreating from a supply zone. On Binance’s four-hour chart on Tuesday, the candle showed an open at $3.43, a high at $3.47, a low at $3.34, and a close at $3.36, marking a 1.3 percent decline for the session.
Highlights
- Toncoin is holding above the $3.35 support area on Monday after a pullback from last week’s rally toward $3.75.
- Buyers are aiming to reclaim $3.45 and retest the $3.60 supply zone, with $3.70–$3.75 as the next major target.
- A break below $3.30 could shift control to sellers and open the path for a deeper decline toward $3.03.
The climb into the $3.60 to $3.75 resistance band quickly met selling pressure, triggering a rotation back into the breakout area. The pullback has been orderly so far, with higher lows from early July intact and a rising trendline supporting the structure. The tone is mixed rather than weak. The four-hour exponential moving averages (EMAs) are closely stacked, with the 20-EMA at $3.3688, the 50-EMA at $3.3684, the 100-EMA at $3.3505, and the 200-EMA at $3.2742.
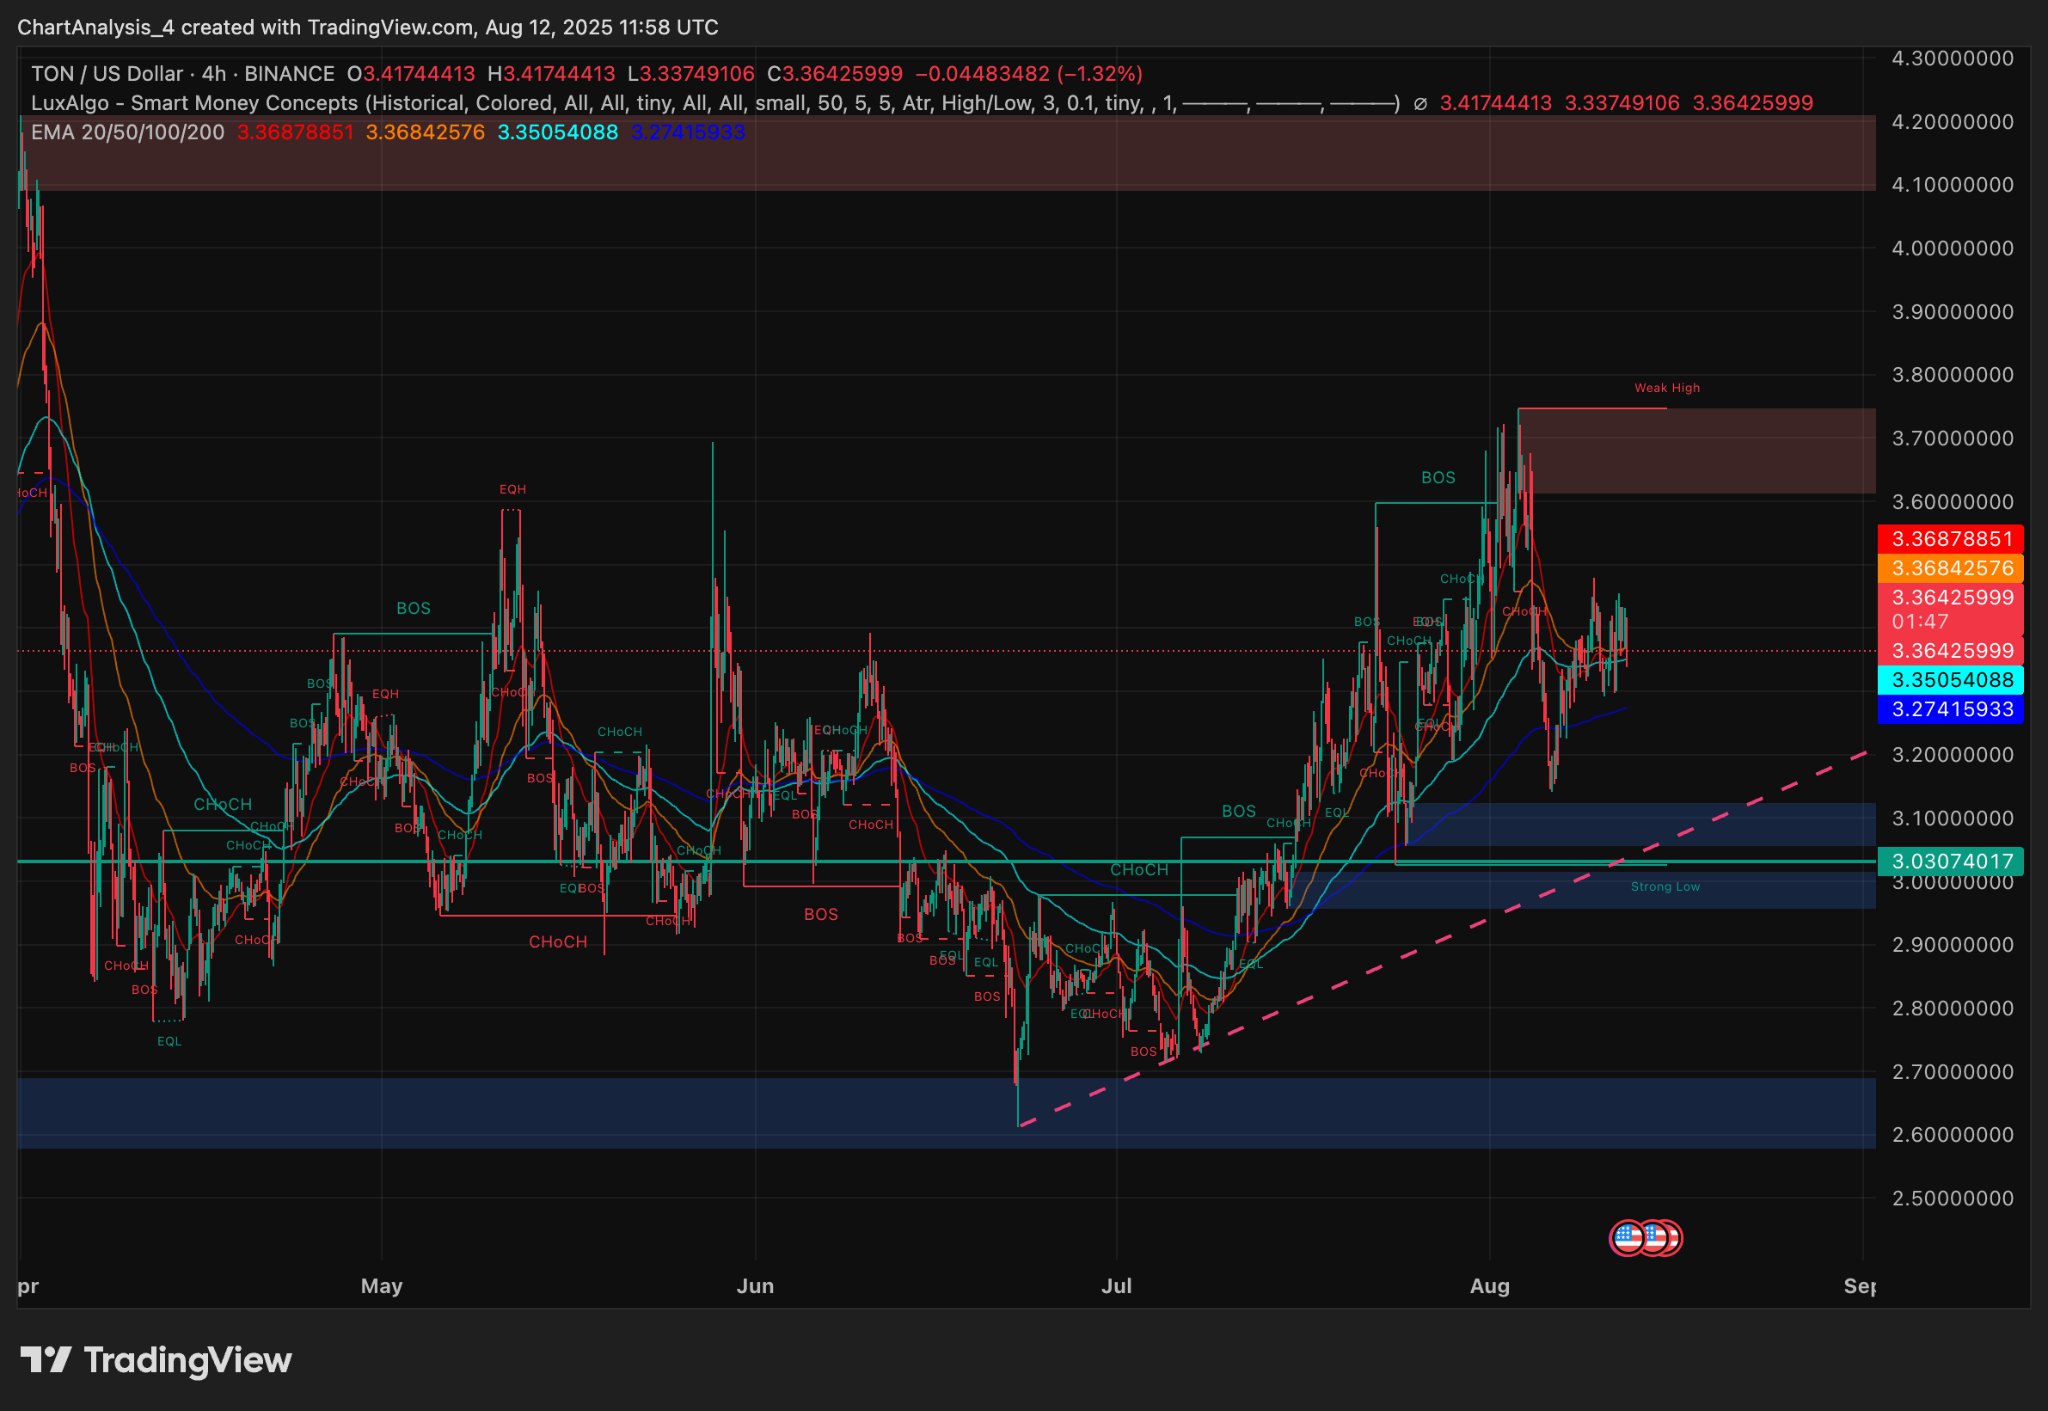
TON price dynamics (Source: TradingView)
TON price sits just under the short-term EMAs but remains above the longer-term ones. This alignment signals that near-term momentum has cooled, while the intermediate bias stays positive. The $3.35 zone around the EMA-100 has repeatedly acted as a pivot, with buyers defending it on initial touches and rebounds pushing toward $3.45 to $3.50 before supply reasserted.
Technical map shows clear bullish and bearish triggers
The July uptrend broke through the $3.30 neckline before stalling beneath a thick supply block labeled “weak high” just under $3.70. That rejection sparked the current retracement, but no major structural damage has occurred as long as the rising base holds. The first demand shelf is between $3.34 and $3.37, where the EMA-100 aligns with prior change-of-character signals and the breakout retest. Below that, the $3.27 to $3.30 zone combines the EMA-200 with the rising trendline. A decisive break of this cluster would tilt control toward sellers and expose the deeper demand zone above $3.10, extending to the strong low at $3.03.
On the daily chart, the Parabolic SAR remains above price at $3.61, indicating the trend has not flipped bearish despite the pullback. The daily relative strength index (RSI) is at 53.53 against its smoothing line at 57.72, a reading consistent with constructive but not overstretched momentum. Historically, RSI readings in the mid-50s during support retests have favored shallow pullbacks that resolve higher once a new higher low forms.NetFlow data also points to a supportive backdrop. On August 12, the netflow print was negative 178.13K, with Toncoin trading near $3.37. Sustained negative netflows signal coins moving off exchanges, reducing available supply and helping shorten dips in healthy trends. Green spikes in netflows into local highs, often indicating supply build-ups before resistance testing, serve as a cautionary note.
Macro view and short-term trade parameters
For bulls, the first step is defending $3.35. A four-hour close back above the EMA-20 and EMA-50 near $3.368 to $3.369, followed by acceptance over $3.45, would restore momentum and target the $3.58 to $3.60 pocket. Clearing this zone would bring the daily Parabolic SAR into play at $3.6063. A daily close above that level would mark the strongest technical improvement since July and set up a run toward $3.70 to $3.75. Breaking above that resistance could open the path to $3.85 to $3.90, with the round number at $4.00 as an eventual magnet.
For bears, a close below $3.35 and follow-through under $3.30 would pressure the $3.27 to $3.30 confluence of the EMA-200 and rising trendline. Losing this area could trigger a slide toward $3.12 to $3.18 and then the $3.03 strong-low zone. A break there would represent a trend change on this timeframe and could send the asset into the deeper accumulation area beginning in the high $2.60s.
Smart-money tags align with this map. While localized change-of-character signals have appeared during the pullback, no break-of-structure to the downside has been recorded on the four-hour chart. This observation explains why moving average zones continue to hold on first touches. Only a confirmed break-of-structure with price closing under the EMA-200 would validate a deeper mean reversion.
In earlier coverage, we noted that Toncoin’s July breakout above $3.30 shifted the bias to bullish, while highlighting the $3.60 to $3.75 supply zone as the first significant hurdle. That area remains a key inflection point, with the current pullback offering another test of whether bulls can sustain higher lows into the next challenge.


Latest TON News


-
 Afghanistan
-
 Albania
-
 Algeria
-
 Angola
-
 Argentina
-
 Armenia
-
 Australia
-
 Austria
-
 Azerbaijan
-
 Bahamas
-
 Bahrain
-
 Bangladesh
-
 Belarus
-
 Belgium
-
 Bolivia
-
 Botswana
-
 Brazil
-
 Brunei
-
 Bulgaria
-
 Cambodia
-
 Cameroon
-
 Canada
-
 Chile
Chile
-
 China
China
-
 Colombia
-
 Congo
Congo
-
 Costa Rica
-
 Cote d'Ivoire
-
 Croatia
-
 Cuba
Cuba
-
 Cyprus
-
 Czechia
-
 DR Congo
-
 Denmark
-
 Dominican Republic
-
 Ecuador
-
 Egypt
Egypt
-
 El Salvador
-
 Estonia
-
 Eswatini
-
 Ethiopia
-
 Finland
-
 France
-
 Georgia
-
 Germany
-
 Ghana
Ghana
-
 Greece
-
 Haiti
Haiti
-
 Hong Kong
-
 Hungary
-
 India
India
-
 Indonesia
-
 Iran, Islamic republic
-
 Iraq
Iraq
-
 Ireland
-
 Israel
-
 Italy
Italy
-
 Jamaica
-
 Japan
Japan
-
 Jordan
-
 Kazakhstan
-
 Kenya
Kenya
-
 Korea
Korea
-
 Kuwait
-
 Kyrgyzstan
-
 Laos
Laos
-
 Latvia
-
 Lebanon
-
 Lesotho
-
 Libya
Libya
-
 Lithuania
-
 Luxembourg
-
 Madagascar
-
 Malaysia
-
 Malta
Malta
-
 Mauritius
-
 Mexico
-
 Moldova
-
 Mongolia
-
 Montenegro
-
 Morocco
-
 Mozambique
-
 Myanmar
-
 Namibia
-
 Nepal
Nepal
-
 Netherlands
-
 New Zealand
-
 Nigeria
-
 North Macedonia
-
 Norway
-
 Oman
Oman
-
 Pakistan
-
 Palestine
-
 Panama
-
 Papua New Guinea
-
 Paraguay
-
 Peru
Peru
-
 Philippines
-
 Poland
-
 Portugal
-
 Puerto Rico
-
 Qatar
Qatar
-
 Reunion
-
 Romania
-
 Rwanda
-
 Saudi Arabia
-
 Serbia
-
 Singapore
-
 Slovakia
-
 Slovenia
-
 Somalia
-
 South Africa
-
 Spain
Spain
-
 Sri Lanka
-
 Sweden
-
 Switzerland
-
 Syria
Syria
-
 Taiwan
-
 Tajikistan
-
 Tanzania
-
 Thailand
-
 Trinidad and Tobago
-
 Tunisia
-
 Turkey
-
 UAE
UAE
-
 Uganda
-
 Ukraine
-
 United Kingdom
-
United States
-
 Uruguay
-
 Uzbekistan
-
 Venezuela
-
 Vietnam
-
 Yemen
Yemen
-
 Zambia
-
 Zimbabwe
- Forex
- Crypto
