
XRP price prediction: Massive outflows and falling open interest threaten $2.20 support

XRP edged lower on Friday, trading near $2.23 after a sharp intraday fade pushed the token toward the lower boundary of its year-long symmetrical triangle. The move reflects a decisive shift in sentiment as sellers regain control, with structural pressure showing across charts, spot flows and derivatives positioning.
Highlights
- XRP trades near $2.23, leaning on the lower boundary of its year-long triangle.
- Spot outflows reach –$23M on Nov. 14, extending multi-month distribution.
- Open interest drops more than 8% to $3.59B as traders reduce exposure.
Price is now testing an area that has repeatedly served as the last line of defense for bulls, setting up a pivotal battle between long-term trend support and sustained distribution.
Pressure builds as technical structure weakens
XRP’s daily chart shows the token trapped between a descending trendline from the July peak and the rising support that has guided each recovery since March. Rally attempts have weakened steadily over the past six weeks, with each high forming lower than the last. Price now trades beneath all major EMAs. The 20-day EMA at $2.39 stands as the first ceiling, followed by the 50-day at $2.53 and 100-day at $2.57. This alignment reflects clear bearish momentum as sellers continue to dominate.
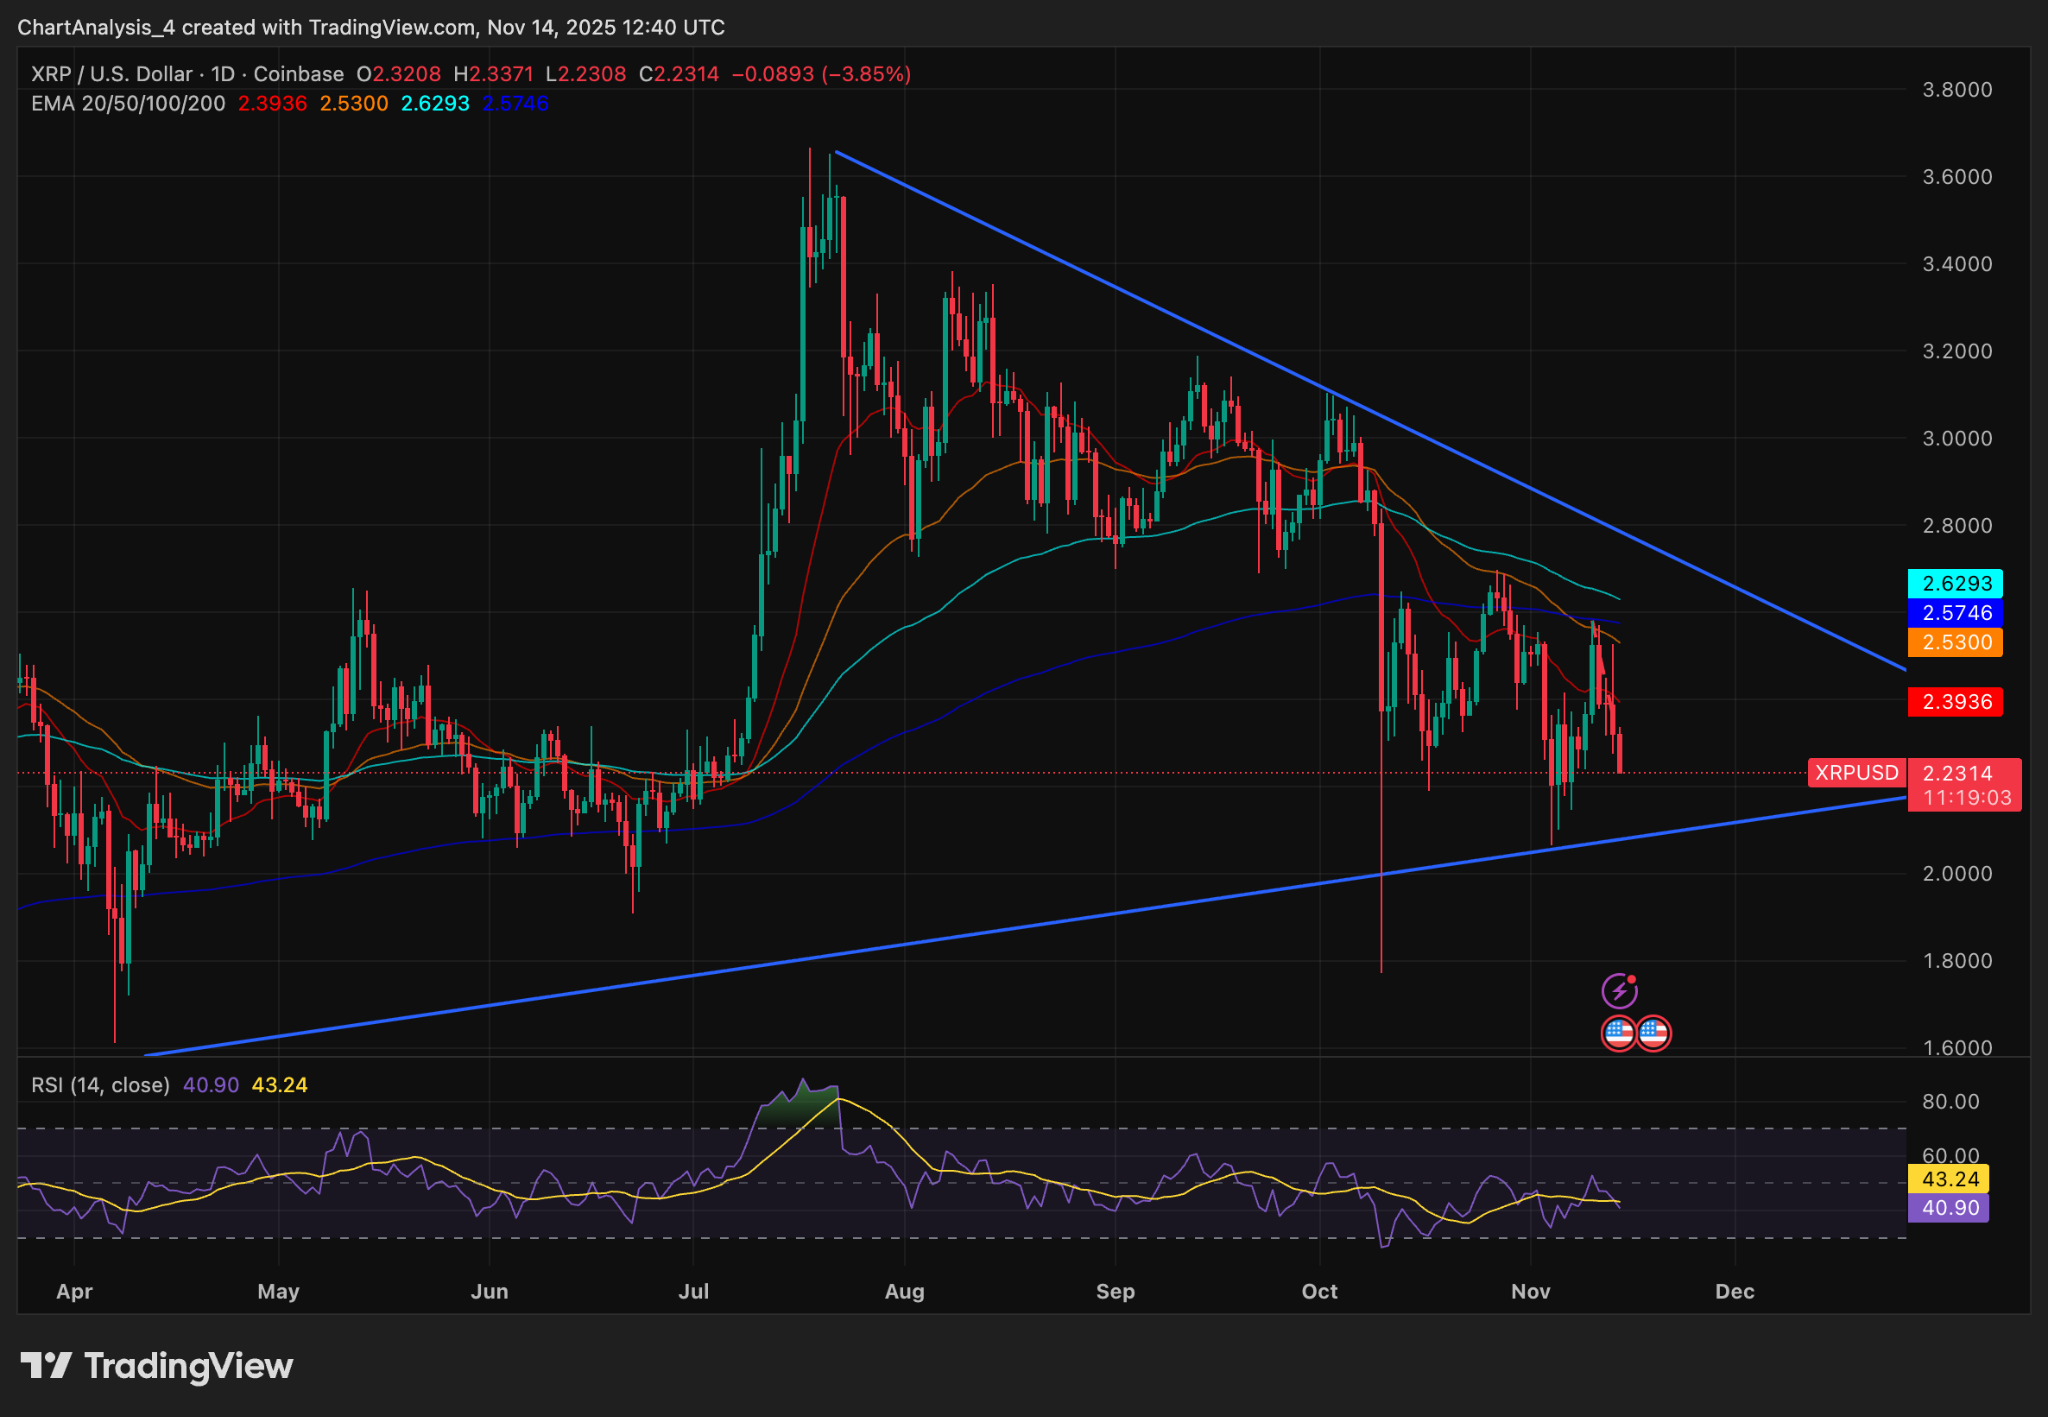
XRP price analysis (Source: TradingView)
The RSI hovers around 41, signaling weak momentum without entering oversold territory. That profile often precedes additional grinding downside rather than sharp reversals. With volatility compressing near the triangle’s apex, a breakout becomes increasingly likely. Given the current structure, the bias leans toward a downward resolution unless demand strengthens quickly.
Spot flows underscore the trend. XRP registered another –$23 million net outflow on November 14, continuing a long streak of red prints. Inflows have been scarce for months, with the market sending supply back to exchanges instead of accumulating. Each major down-leg this year followed similar periods of extended negative flow pressure, making the current pattern a familiar risk signal.
Flows, derivatives and positioning confirm cautious sentiment
Derivatives markets show reduced willingness to take on exposure. Open interest has fallen more than 8 percent to $3.59 billion, reflecting trader hesitation rather than any effort to position for a reversal. Options activity has collapsed, with declining volume and open interest suggesting little appetite for directional risk. Funding remains neutral to slightly bearish across major venues. Long-short ratios highlight a divided market. Retail-heavy platforms show a bias toward longs, but top-trader data reveal more balanced exposure. Larger accounts appear to be waiting for a breakdown rather than attempting to catch dips, aligning with the muted speculative interest in derivatives.
A critical support zone sits at $2.15–$2.18, where the ascending trendline has held since March. A clean break below this band would open a move toward $2.00, followed by $1.85, an area tied to the June consolidation and the lower extension of the triangle. On the upside, bulls need a firm reclaim of $2.39 to slow momentum and a break above $2.53 to begin neutralizing the broader decline.
For now, XRP faces sustained pressure from negative flows, weakening structure and falling open interest. The next sessions around the trendline will determine whether the token can defend its long-term support or enters a deeper corrective phase.
In earlier analysis, we noted that XRP’s weakening rallies and persistent negative flows left the token vulnerable to a retest of its lower triangle boundary. This week’s decline confirms that setup as price leans directly into the multi-month support zone.


-
 Afghanistan
-
 Albania
-
 Algeria
-
 Angola
-
 Argentina
-
 Armenia
-
 Australia
-
 Austria
-
 Azerbaijan
-
 Bahamas
-
 Bahrain
-
 Bangladesh
-
 Belarus
-
 Belgium
-
 Bolivia
-
 Botswana
-
 Brazil
-
 Brunei
-
 Bulgaria
-
 Cambodia
-
 Cameroon
-
 Canada
-
 Chile
Chile
-
 China
China
-
 Colombia
-
 Congo
Congo
-
 Costa Rica
-
 Cote d'Ivoire
-
 Croatia
-
 Cuba
Cuba
-
 Cyprus
-
 Czechia
-
 DR Congo
-
 Denmark
-
 Dominican Republic
-
 Ecuador
-
 Egypt
Egypt
-
 El Salvador
-
 Estonia
-
 Eswatini
-
 Ethiopia
-
 Finland
-
 France
-
 Georgia
-
 Germany
-
 Ghana
Ghana
-
 Greece
-
 Haiti
Haiti
-
 Hong Kong
-
 Hungary
-
 India
India
-
 Indonesia
-
 Iran, Islamic republic
-
 Iraq
Iraq
-
 Ireland
-
 Israel
-
 Italy
Italy
-
 Jamaica
-
 Japan
Japan
-
 Jordan
-
 Kazakhstan
-
 Kenya
Kenya
-
 Korea
Korea
-
 Kuwait
-
 Kyrgyzstan
-
 Laos
Laos
-
 Latvia
-
 Lebanon
-
 Lesotho
-
 Libya
Libya
-
 Lithuania
-
 Luxembourg
-
 Madagascar
-
 Malaysia
-
 Malta
Malta
-
 Mauritius
-
 Mexico
-
 Moldova
-
 Mongolia
-
 Montenegro
-
 Morocco
-
 Mozambique
-
 Myanmar
-
 Namibia
-
 Nepal
Nepal
-
 Netherlands
-
 New Zealand
-
 Nigeria
-
 North Macedonia
-
 Norway
-
 Oman
Oman
-
 Pakistan
-
 Palestine
-
 Panama
-
 Papua New Guinea
-
 Paraguay
-
 Peru
Peru
-
 Philippines
-
 Poland
-
 Portugal
-
 Puerto Rico
-
 Qatar
Qatar
-
 Reunion
-
 Romania
-
 Rwanda
-
 Saudi Arabia
-
 Serbia
-
 Singapore
-
 Slovakia
-
 Slovenia
-
 Somalia
-
 South Africa
-
 Spain
Spain
-
 Sri Lanka
-
 Sweden
-
 Switzerland
-
 Syria
Syria
-
 Taiwan
-
 Tajikistan
-
 Tanzania
-
 Thailand
-
 Trinidad and Tobago
-
 Tunisia
-
 Turkey
-
 UAE
UAE
-
 Uganda
-
 Ukraine
-
 United Kingdom
-
United States
-
 Uruguay
-
 Uzbekistan
-
 Venezuela
-
 Vietnam
-
 Yemen
Yemen
-
 Zambia
-
 Zimbabwe
- Forex
- Crypto
