
Gold price forecast: XAU holds $4,360 after biggest drop since October

Gold is stabilizing above the $4,360 area on Tuesday after one of the most violent shakeouts the market has seen this year, and the signal from price action is unambiguous. This was not a trend break. It was a hard reset.
Highlights
- Gold holds above $4,360 after a 4% intraday drop, its sharpest since October.
- Price remains above rising long-term averages, preserving the primary uptrend.
- Geopolitical risk and rate-cut expectations continue to support demand.
Monday’s 4% slide, the largest intraday drop since October, flushed leveraged longs and forced late-year profit-taking, but follow-through selling failed to appear. Buyers returned quickly, keeping bullion supported as geopolitical risk and expectations for future rate cuts continue to anchor demand. The speed of the rebound has shifted focus away from the size of the decline and toward what did not happen next. There was no cascade lower, no sustained liquidation, and no breach of key trend levels. Instead, the market absorbed the shock and stabilized, a pattern that has repeated during prior corrections within this bull cycle.
Trend structure remains intact despite the flush
On the daily chart, gold remains firmly within a broader uptrend. Price is still trading comfortably above the 50-, 100-, and 200-day EMAs, with the 200-day EMA rising near the mid-$3,650s. That long-term slope matters. Every major correction this year that held above the 100-day EMA has ultimately resolved higher, and this pullback is tracking a similar path so far. The 20-day EMA near $4,325 has emerged as first dynamic support, cushioning the post-selloff consolidation. Below that, the 50-day EMA around $4,180 marks the deeper line bulls cannot afford to lose if the broader trend is to remain intact. As long as price holds above that zone, the technical framework continues to favor higher prices over time.
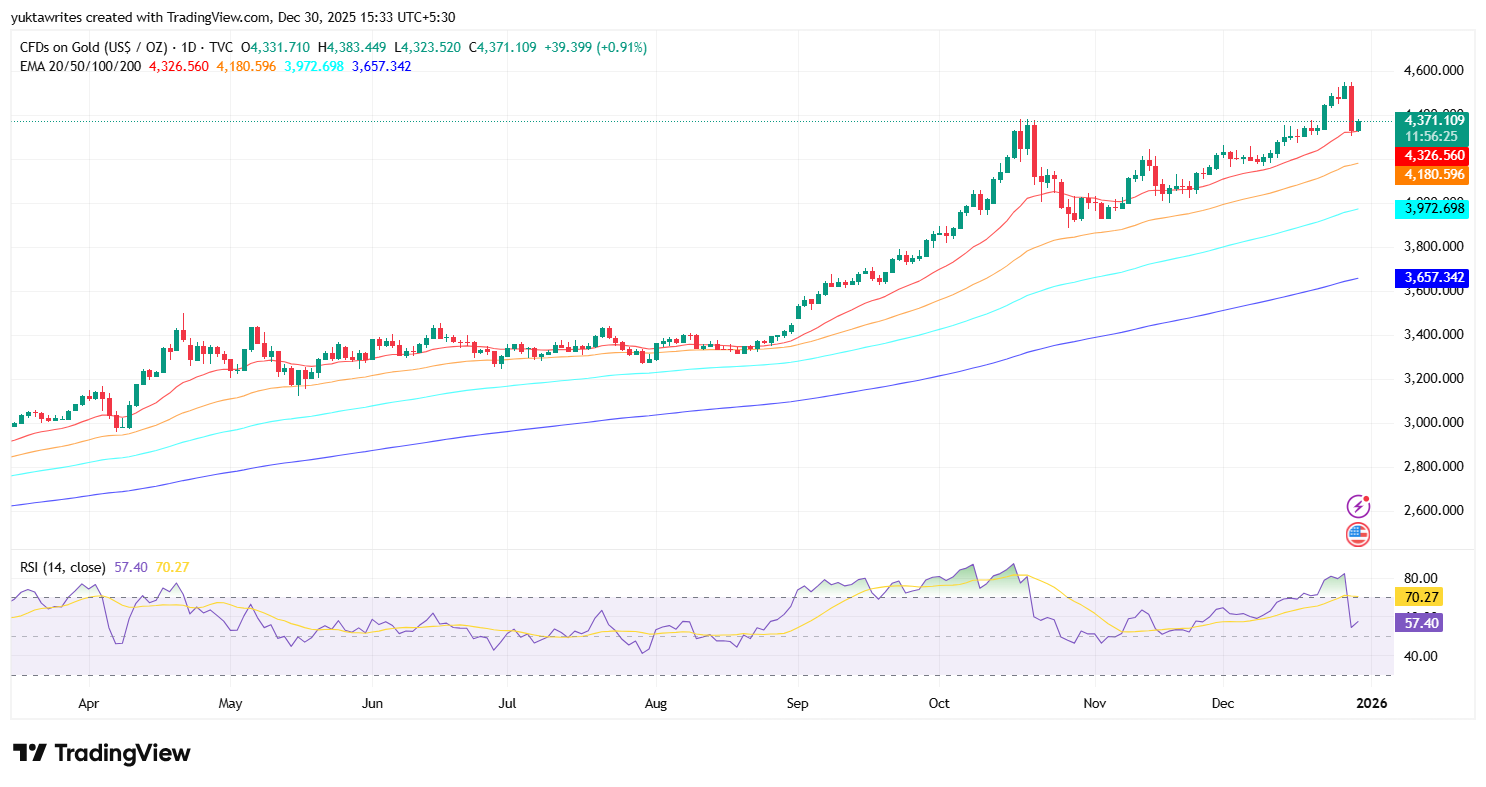
Gold price dynamics (Source: TradingView)
Momentum indicators support the reset narrative. Daily RSI has cooled sharply from overbought conditions and now hovers in the high-50s. In strong bull markets, this zone typically signals consolidation rather than reversal. There is no bearish divergence on the higher timeframe. Instead, momentum is unwinding excess froth built during November’s near-vertical rally, creating room for the trend to extend without requiring another aggressive washout.
Lower timeframes reveal a more tactical battle. On the 30-minute chart, gold sliced through short-term support during Monday’s selloff before finding a firm base just above $4,300. Since then, price has shifted into a tight consolidation, printing higher lows against a flattening Supertrend. That structure suggests sellers are losing urgency. Short-term resistance sits between $4,380 and $4,400, where prior breakdown candles originated. A clean reclaim of that zone would likely attract momentum-based buying toward $4,460 and potentially a retest of the $4,500 highs.
Volume behavior reinforces the idea that the worst of the selling is behind the market. The heaviest volume spike coincided with the initial drop, a classic capitulation signature. Subsequent sessions have traded on lighter volume, indicating liquidation pressure has largely passed. This pattern is consistent with late-cycle bull markets, where corrections tend to be sharp, emotional, and brief rather than prolonged and grinding.
Macro and fundamentals continue to underpin demand
Beyond charts, the fundamental backdrop remains supportive. Safe-haven demand has resurfaced as hopes for a swift resolution to the Russia-Ukraine conflict faded following reports of strikes near President Vladimir Putin’s residence and warnings that Moscow’s negotiating stance could harden. Tensions involving Iran and Venezuela have added another layer of geopolitical uncertainty, reinforcing gold’s role as insurance rather than a tactical trade.
Central bank demand continues at a pace not seen in decades, providing a steady bid beneath the market. Exchange-traded fund flows have remained resilient even during the pullback, suggesting longer-term investors have not rushed for the exits. At the same time, markets are increasingly pricing further U.S. rate cuts in 2026. Expectations of lower real yields have historically supported precious metals, limiting downside pressure even during periods of heightened volatility.
Market outlook
From here, the bullish roadmap is clear. As long as gold holds above the $4,300 to $4,320 support band on a daily closing basis, dips are likely to be absorbed. A sustained move back above $4,400 would put $4,500 into focus, with extension potential toward $4,600 if momentum accelerates and macro uncertainty persists into early 2026. Trend followers will view consolidation above a rising 50-day EMA as constructive rather than concerning.
The bearish case hinges on a failure of support rather than sentiment shifts. A decisive daily close below $4,180 would be the first indication that the move was more than profit-taking. That would expose the $4,000 psychological level and potentially the 100-day EMA near $3,970. For now, that scenario appears secondary unless geopolitical risk fades abruptly and economic data forces markets to reprice rate expectations higher.
Previously, we noted that gold’s parabolic advance left it vulnerable to sharp, sudden corrections even as the broader trend remained constructive. This week’s move has validated that view. The flush cleared excess positioning without damaging the long-term structure.Gold is transitioning from a vertical rally into a digestion phase. If support continues to hold, this episode is likely to be remembered as a reset, not a top.


Latest XAU/USD News


-
 Afghanistan
-
 Albania
-
 Algeria
-
 Angola
-
 Argentina
-
 Armenia
-
 Australia
-
 Austria
-
 Azerbaijan
-
 Bahamas
-
 Bahrain
-
 Bangladesh
-
 Belarus
-
 Belgium
-
 Bolivia
-
 Botswana
-
 Brazil
-
 Brunei
-
 Bulgaria
-
 Cambodia
-
 Cameroon
-
 Canada
-
 Chile
Chile
-
 China
China
-
 Colombia
-
 Congo
Congo
-
 Costa Rica
-
 Cote d'Ivoire
-
 Croatia
-
 Cuba
Cuba
-
 Cyprus
-
 Czechia
-
 DR Congo
-
 Denmark
-
 Dominican Republic
-
 Ecuador
-
 Egypt
Egypt
-
 El Salvador
-
 Estonia
-
 Eswatini
-
 Ethiopia
-
 Finland
-
 France
-
 Georgia
-
 Germany
-
 Ghana
Ghana
-
 Greece
-
 Haiti
Haiti
-
 Hong Kong
-
 Hungary
-
 India
India
-
 Indonesia
-
 Iran, Islamic republic
-
 Iraq
Iraq
-
 Ireland
-
 Israel
-
 Italy
Italy
-
 Jamaica
-
 Japan
Japan
-
 Jordan
-
 Kazakhstan
-
 Kenya
Kenya
-
 Korea
Korea
-
 Kuwait
-
 Kyrgyzstan
-
 Laos
Laos
-
 Latvia
-
 Lebanon
-
 Lesotho
-
 Libya
Libya
-
 Lithuania
-
 Luxembourg
-
 Madagascar
-
 Malaysia
-
 Malta
Malta
-
 Mauritius
-
 Mexico
-
 Moldova
-
 Mongolia
-
 Montenegro
-
 Morocco
-
 Mozambique
-
 Myanmar
-
 Namibia
-
 Nepal
Nepal
-
 Netherlands
-
 New Zealand
-
 Nigeria
-
 North Macedonia
-
 Norway
-
 Oman
Oman
-
 Pakistan
-
 Palestine
-
 Panama
-
 Papua New Guinea
-
 Paraguay
-
 Peru
Peru
-
 Philippines
-
 Poland
-
 Portugal
-
 Puerto Rico
-
 Qatar
Qatar
-
 Reunion
-
 Romania
-
 Rwanda
-
 Saudi Arabia
-
 Serbia
-
 Singapore
-
 Slovakia
-
 Slovenia
-
 Somalia
-
 South Africa
-
 Spain
Spain
-
 Sri Lanka
-
 Sweden
-
 Switzerland
-
 Syria
Syria
-
 Taiwan
-
 Tajikistan
-
 Tanzania
-
 Thailand
-
 Trinidad and Tobago
-
 Tunisia
-
 Turkey
-
 UAE
UAE
-
 Uganda
-
 Ukraine
-
 United Kingdom
-
United States
-
 Uruguay
-
 Uzbekistan
-
 Venezuela
-
 Vietnam
-
 Yemen
Yemen
-
 Zambia
-
 Zimbabwe
- Forex
- Crypto
