
+5.02% for Globalstar stock — buyers control rally with price near session highs

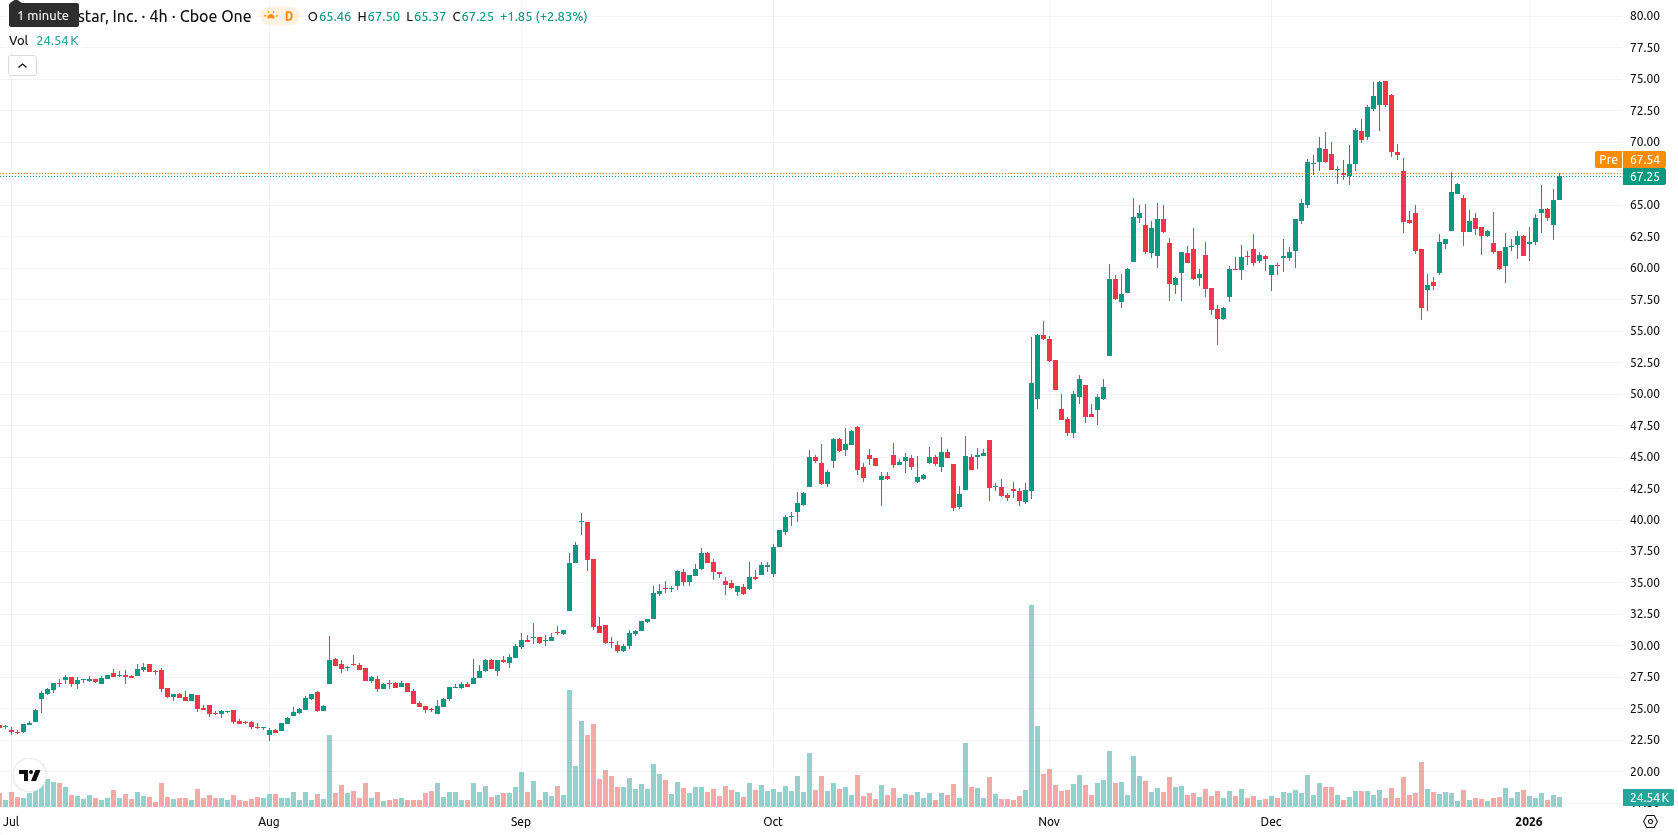
Globalstar, Inc. (GSAT) is trading at $67.30, up 5.02% for the day. The price is positioned above the MA-20 ($64.91), MA-50 ($59.76), and MA-200 ($34.85), reflecting a clear bullish structure across the short, medium, and long term.
Highlights
- GSAT closed at $67.30, gaining 5.02% in the session, and remains above the MA-20 ($64.91), MA-50 ($59.76), and MA-200 ($34.85) averages.
- Bullish signals dominate as MACD, ADX, and strong momentum persist, while the $65.33 Ichimoku Kijun and MA-50 serve as dynamic supports.
- Expected trading range for the coming week is $64.00 to $72.00, with an over 80% probability of continued price strength unless price falls below $64 support.
Aggressive buying and overbought signals as volatility accelerates
Technically, GSAT benefits from the $65.33 Ichimoku Kijun level serving as dynamic support, with the MA-50 below as the next support zone. The MACD and ADX indicate ongoing bullish momentum, while RSI and CCI remain neutral to slightly positive. Stochastic RSI and Bull/Bear Power show overbought conditions and highlight aggressive buyer activity, with high volatility and the price rallying near session highs.
High breakout potential as bullish consolidation dominates outlook
Looking ahead to the coming week, the typical volatility band is $64.00 to $72.00, consistent with current price action. There is a very high probability (over 80%) of continued price increases, while a downward move appears less likely. The base case scenario points to consolidation within the $64 to $72 range. A bullish breakout could occur above $72 with sustained momentum, whereas a drop below $64 would indicate a reversal.
Previously it was reported that Globalstar Inc. (GSAT) demonstrated strong bullish momentum, trading well above key moving averages and maintaining its position over critical trend levels, with buyer strength confirmed by positive MACD and ADX readings. While the RSI remains supportive, several oscillators signal overbought conditions, suggesting cautious near-term outlook even as dynamic support is established above primary downside levels.


Latest Globalstar News


-
 Afghanistan
-
 Albania
-
 Algeria
-
 Angola
-
 Argentina
-
 Armenia
-
 Australia
-
 Austria
-
 Azerbaijan
-
 Bahamas
-
 Bahrain
-
 Bangladesh
-
 Belarus
-
 Belgium
-
 Bolivia
-
 Botswana
-
 Brazil
-
 Brunei
-
 Bulgaria
-
 Cambodia
-
 Cameroon
-
 Canada
-
 Chile
Chile
-
 China
China
-
 Colombia
-
 Congo
Congo
-
 Costa Rica
-
 Cote d'Ivoire
-
 Croatia
-
 Cuba
Cuba
-
 Cyprus
-
 Czechia
-
 DR Congo
-
 Denmark
-
 Dominican Republic
-
 Ecuador
-
 Egypt
Egypt
-
 El Salvador
-
 Estonia
-
 Eswatini
-
 Ethiopia
-
 Finland
-
 France
-
 Georgia
-
 Germany
-
 Ghana
Ghana
-
 Greece
-
 Haiti
Haiti
-
 Hong Kong
-
 Hungary
-
 India
India
-
 Indonesia
-
 Iran, Islamic republic
-
 Iraq
Iraq
-
 Ireland
-
 Israel
-
 Italy
Italy
-
 Jamaica
-
 Japan
Japan
-
 Jordan
-
 Kazakhstan
-
 Kenya
Kenya
-
 Korea
Korea
-
 Kuwait
-
 Kyrgyzstan
-
 Laos
Laos
-
 Latvia
-
 Lebanon
-
 Lesotho
-
 Libya
Libya
-
 Lithuania
-
 Luxembourg
-
 Madagascar
-
 Malaysia
-
 Malta
Malta
-
 Mauritius
-
 Mexico
-
 Moldova
-
 Mongolia
-
 Montenegro
-
 Morocco
-
 Mozambique
-
 Myanmar
-
 Namibia
-
 Nepal
Nepal
-
 Netherlands
-
 New Zealand
-
 Nigeria
-
 North Macedonia
-
 Norway
-
 Oman
Oman
-
 Pakistan
-
 Palestine
-
 Panama
-
 Papua New Guinea
-
 Paraguay
-
 Peru
Peru
-
 Philippines
-
 Poland
-
 Portugal
-
 Puerto Rico
-
 Qatar
Qatar
-
 Reunion
-
 Romania
-
 Rwanda
-
 Saudi Arabia
-
 Serbia
-
 Singapore
-
 Slovakia
-
 Slovenia
-
 Somalia
-
 South Africa
-
 Spain
Spain
-
 Sri Lanka
-
 Sweden
-
 Switzerland
-
 Syria
Syria
-
 Taiwan
-
 Tajikistan
-
 Tanzania
-
 Thailand
-
 Trinidad and Tobago
-
 Tunisia
-
 Turkey
-
 UAE
UAE
-
 Uganda
-
 Ukraine
-
 United Kingdom
-
United States
-
 Uruguay
-
 Uzbekistan
-
 Venezuela
-
 Vietnam
-
 Yemen
Yemen
-
 Zambia
-
 Zimbabwe
- Forex
- Crypto
