
AstraZeneca stock price forecast: bullish outlook as AZN trades above key moving averages

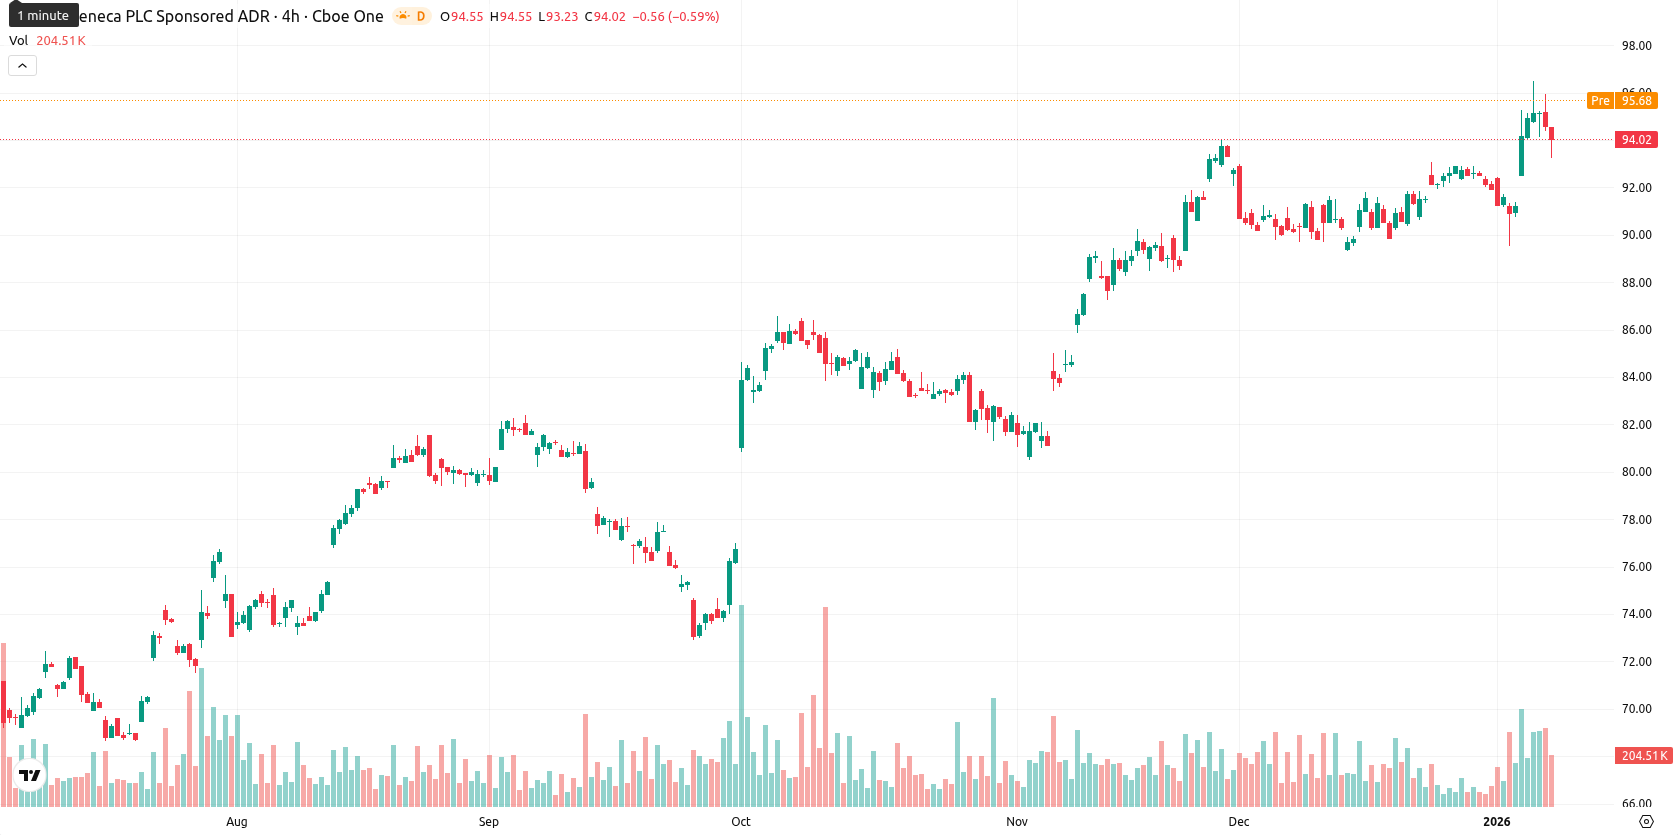
AstraZeneca PLC (AZN) is trading well above its key moving averages, with the current price of GBX 14,226.00 up GBX 50.00 (0.35%) today. The asset remains above the MA-20, MA-50, and MA-200, reinforcing a bullish structure across all monitored timeframes.
Highlights
- AstraZeneca appointed Rick Suarez as US president to oversee a $50 billion investment strategy, including a $4.5 billion manufacturing facility in Virginia.
- The company has paid dividends for 33 consecutive years, maintaining a current yield of approximately 1.06%, signaling consistent shareholder returns.
- These developments underscore AstraZeneca’s operational stability and ongoing commitment to U.S. expansion as part of its long-term revenue growth agenda.
Leadership shakeup and investments underscore expansion and dividend focus
AstraZeneca has appointed Rick Suarez as US president to oversee its $50 billion investment strategy, which includes a planned $4.5 billion manufacturing facility in Virginia as part of its long-term U.S. expansion and revenue growth agenda. The company continues to maintain a strong dividend track record, having paid out for 33 consecutive years with a current yield of approximately 1.06%. These developments highlight the company’s operational stability and ongoing commitment to expansion and consistent shareholder returns.
Overbought signals emerge as strong bullish momentum faces resistance
With price positioned above both key moving averages and the Ichimoku Kijun (GBX 14,376.18) acting as dynamic resistance, immediate support sits near the MA-20, while the next resistance is seen just above the recent highs and the Ichimoku Kijun. Momentum remains strongly positive, as highlighted by a bullish MACD and a robust ADX on the daily chart. However, several oscillators signal caution: both the RSI (63.87) and CCI (176.46) are in overbought territory, while Stochastic RSI and Bull/Bear Power indicate buyers are in control, but in potentially overextended conditions. The Awesome Oscillator is neutral, not contradicting the prevailing upside bias.
Bullish breakout favored as volatility narrows and technicals align
Looking ahead, the expected price range for the next five trading days is GBX 13,950 to GBX 14,350, aligned with typical blue-chip weekly volatility and adjusted for proximity to current levels. The probability of a further price increase is very high (more than 80%), as all major weekly indicators — RSI, ADX, MACD, and MA-50 — point to bullish continuation. In the baseline scenario, AZN is likely to trade sideways within this band amid continued positive momentum. A bullish scenario envisions a breakout above resistance if buyers maintain control, while a bearish reversal would require a break below the MA-20, which is less likely without external catalysts.
Previously it was reported that AstraZeneca PLC continues to exhibit strong bullish momentum, with the share price trading well above its major moving averages and supported by robust MACD and ADX readings. Despite persistent buyer strength and potential for further gains above technical resistance, short-term indicators such as RSI and Stochastic RSI highlight overbought conditions and rising volatility, suggesting caution as upside potential remains bracketed by established support and resistance levels.


Latest AstraZeneca News


-
 Afghanistan
-
 Albania
-
 Algeria
-
 Angola
-
 Argentina
-
 Armenia
-
 Australia
-
 Austria
-
 Azerbaijan
-
 Bahamas
-
 Bahrain
-
 Bangladesh
-
 Belarus
-
 Belgium
-
 Bolivia
-
 Botswana
-
 Brazil
-
 Brunei
-
 Bulgaria
-
 Cambodia
-
 Cameroon
-
 Canada
-
 Chile
Chile
-
 China
China
-
 Colombia
-
 Congo
Congo
-
 Costa Rica
-
 Cote d'Ivoire
-
 Croatia
-
 Cuba
Cuba
-
 Cyprus
-
 Czechia
-
 DR Congo
-
 Denmark
-
 Dominican Republic
-
 Ecuador
-
 Egypt
Egypt
-
 El Salvador
-
 Estonia
-
 Eswatini
-
 Ethiopia
-
 Finland
-
 France
-
 Georgia
-
 Germany
-
 Ghana
Ghana
-
 Greece
-
 Haiti
Haiti
-
 Hong Kong
-
 Hungary
-
 India
India
-
 Indonesia
-
 Iran, Islamic republic
-
 Iraq
Iraq
-
 Ireland
-
 Israel
-
 Italy
Italy
-
 Jamaica
-
 Japan
Japan
-
 Jordan
-
 Kazakhstan
-
 Kenya
Kenya
-
 Korea
Korea
-
 Kuwait
-
 Kyrgyzstan
-
 Laos
Laos
-
 Latvia
-
 Lebanon
-
 Lesotho
-
 Libya
Libya
-
 Lithuania
-
 Luxembourg
-
 Madagascar
-
 Malaysia
-
 Malta
Malta
-
 Mauritius
-
 Mexico
-
 Moldova
-
 Mongolia
-
 Montenegro
-
 Morocco
-
 Mozambique
-
 Myanmar
-
 Namibia
-
 Nepal
Nepal
-
 Netherlands
-
 New Zealand
-
 Nigeria
-
 North Macedonia
-
 Norway
-
 Oman
Oman
-
 Pakistan
-
 Palestine
-
 Panama
-
 Papua New Guinea
-
 Paraguay
-
 Peru
Peru
-
 Philippines
-
 Poland
-
 Portugal
-
 Puerto Rico
-
 Qatar
Qatar
-
 Reunion
-
 Romania
-
 Rwanda
-
 Saudi Arabia
-
 Serbia
-
 Singapore
-
 Slovakia
-
 Slovenia
-
 Somalia
-
 South Africa
-
 Spain
Spain
-
 Sri Lanka
-
 Sweden
-
 Switzerland
-
 Syria
Syria
-
 Taiwan
-
 Tajikistan
-
 Tanzania
-
 Thailand
-
 Trinidad and Tobago
-
 Tunisia
-
 Turkey
-
 UAE
UAE
-
 Uganda
-
 Ukraine
-
 United Kingdom
-
United States
-
 Uruguay
-
 Uzbekistan
-
 Venezuela
-
 Vietnam
-
 Yemen
Yemen
-
 Zambia
-
 Zimbabwe
- Forex
- Crypto
