
Nano Dimension stock consolidates as mixed signals and overbought oscillators limit upside

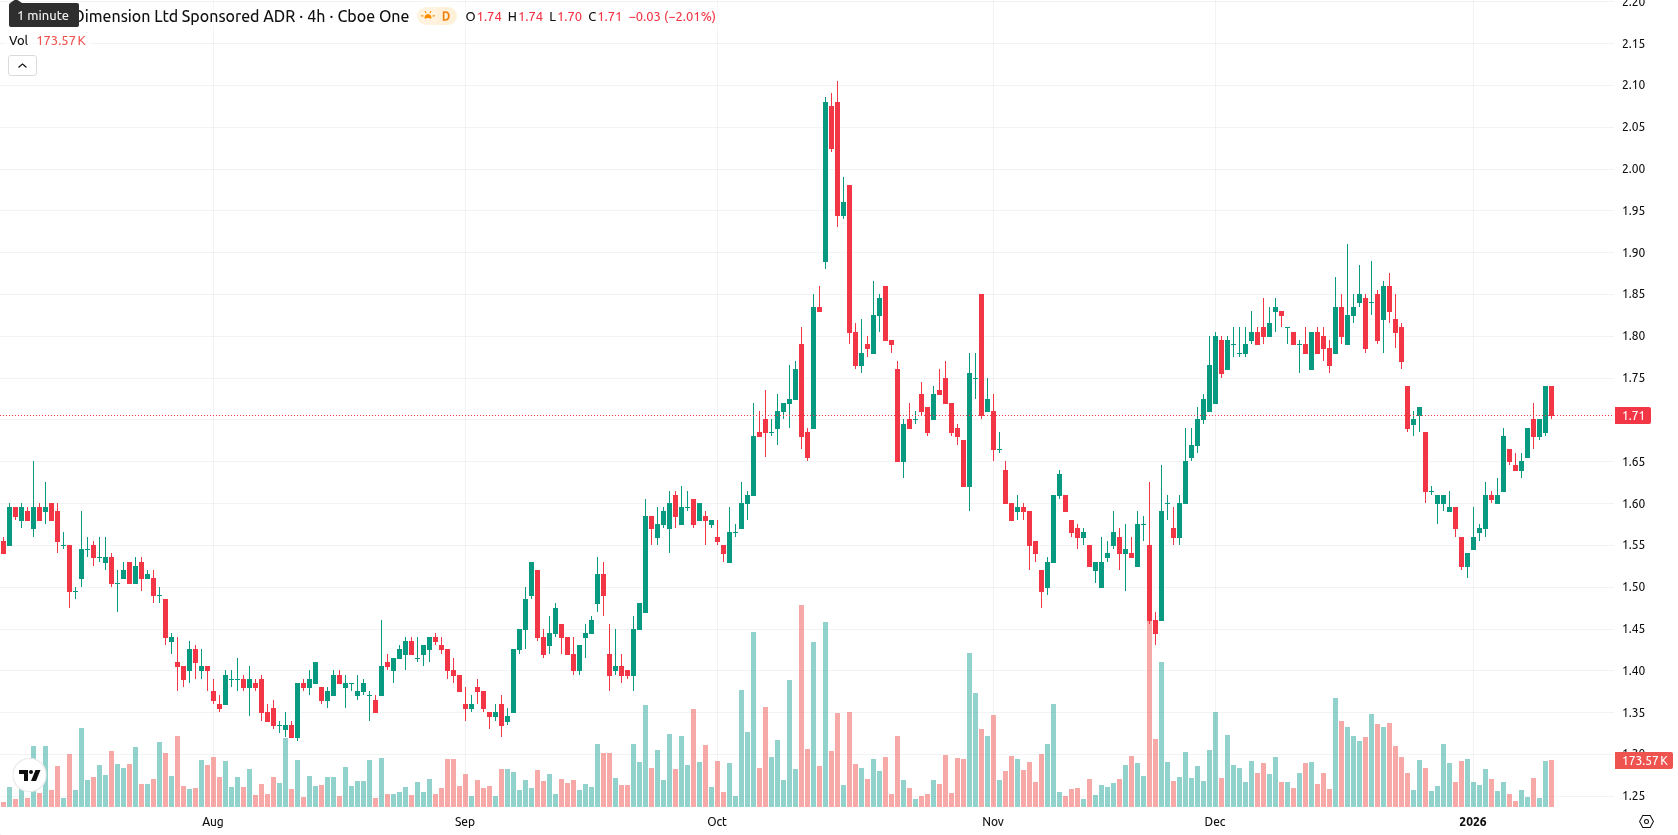
Nano Dimension Ltd (NNDM) is trading at $1.70, sitting above the MA-20 at $1.69 and MA-50 at $1.67, as well as well above the long-term MA-200 at $1.57. This alignment confirms a bullish structure in both the short and medium term, with the closest dynamic resistance near the Ichimoku Kijun at $1.72 and support at MA-50, while the MA positioning does not signal a golden or death cross.
Highlights
- NNDM is trading at $1.70, positioned above MA-20 ($1.69), MA-50 ($1.67), and MA-200 ($1.57), confirming a short-to-medium-term bullish structure.
- Momentum indicators are mixed with daily MACD signaling strong sell, ADX neutral near 13, RSI mildly bullish, and Stochastic RSI in deeply overbought territory.
- Expected five-session trading range is $1.68–$1.76, with a 50% probability of an upward move and potential targets of $1.72 and $1.76 on bullish closes.
Mixed momentum as overbought oscillators meet intraday buying
Momentum signals are mixed: the MACD on the daily shows a strong sell reading, while the ADX signals a weak, neutral trend near 13. Short-term oscillators diverge—RSI points to mild bullishness, but the Stochastic RSI is deeply overbought and the CCI is neutral. Bull/Bear Power is positive at 0.08, reflecting intraday buyer strength, and the Awesome Oscillator holds steady, offering little directional confirmation. Today’s price action is moderately positive, up 0.59% with no notable gap between sessions, and price is sitting mid-range at $1.70 within today’s $1.68 – $1.75 spread. Volatility is moderate and the session reflects a neutral to slightly bullish intraday tone with buying interest after the open. These mixed oscillator signals highlight some divergence between short-term overbought conditions and underlying buyer momentum.
Sideways bias as overbought sentiment tempers bullish breakout
Looking ahead, the expected trading range for the next five sessions is $1.68 to $1.76, adjusted for typical volatility around the current price. The probability of an upward move in the coming week is about 50%, while the chance of a decline is less likely. Baseline scenario shows continued sideways movement within this band as buying and overbought momentum compete. In the bullish case, a close above $1.72 could open the path toward $1.76. A break back below $1.68 would tilt the outlook bearish, targeting short-term retreats toward $1.65 or lower.
No asset data was provided for analysis.


Latest Nano Dimension News


-
 Afghanistan
-
 Albania
-
 Algeria
-
 Angola
-
 Argentina
-
 Armenia
-
 Australia
-
 Austria
-
 Azerbaijan
-
 Bahamas
-
 Bahrain
-
 Bangladesh
-
 Belarus
-
 Belgium
-
 Bolivia
-
 Botswana
-
 Brazil
-
 Brunei
-
 Bulgaria
-
 Cambodia
-
 Cameroon
-
 Canada
-
 Chile
Chile
-
 China
China
-
 Colombia
-
 Congo
Congo
-
 Costa Rica
-
 Cote d'Ivoire
-
 Croatia
-
 Cuba
Cuba
-
 Cyprus
-
 Czechia
-
 DR Congo
-
 Denmark
-
 Dominican Republic
-
 Ecuador
-
 Egypt
Egypt
-
 El Salvador
-
 Estonia
-
 Eswatini
-
 Ethiopia
-
 Finland
-
 France
-
 Georgia
-
 Germany
-
 Ghana
Ghana
-
 Greece
-
 Haiti
Haiti
-
 Hong Kong
-
 Hungary
-
 India
India
-
 Indonesia
-
 Iran, Islamic republic
-
 Iraq
Iraq
-
 Ireland
-
 Israel
-
 Italy
Italy
-
 Jamaica
-
 Japan
Japan
-
 Jordan
-
 Kazakhstan
-
 Kenya
Kenya
-
 Korea
Korea
-
 Kuwait
-
 Kyrgyzstan
-
 Laos
Laos
-
 Latvia
-
 Lebanon
-
 Lesotho
-
 Libya
Libya
-
 Lithuania
-
 Luxembourg
-
 Madagascar
-
 Malaysia
-
 Malta
Malta
-
 Mauritius
-
 Mexico
-
 Moldova
-
 Mongolia
-
 Montenegro
-
 Morocco
-
 Mozambique
-
 Myanmar
-
 Namibia
-
 Nepal
Nepal
-
 Netherlands
-
 New Zealand
-
 Nigeria
-
 North Macedonia
-
 Norway
-
 Oman
Oman
-
 Pakistan
-
 Palestine
-
 Panama
-
 Papua New Guinea
-
 Paraguay
-
 Peru
Peru
-
 Philippines
-
 Poland
-
 Portugal
-
 Puerto Rico
-
 Qatar
Qatar
-
 Reunion
-
 Romania
-
 Rwanda
-
 Saudi Arabia
-
 Serbia
-
 Singapore
-
 Slovakia
-
 Slovenia
-
 Somalia
-
 South Africa
-
 Spain
Spain
-
 Sri Lanka
-
 Sweden
-
 Switzerland
-
 Syria
Syria
-
 Taiwan
-
 Tajikistan
-
 Tanzania
-
 Thailand
-
 Trinidad and Tobago
-
 Tunisia
-
 Turkey
-
 UAE
UAE
-
 Uganda
-
 Ukraine
-
 United Kingdom
-
United States
-
 Uruguay
-
 Uzbekistan
-
 Venezuela
-
 Vietnam
-
 Yemen
Yemen
-
 Zambia
-
 Zimbabwe
- Forex
- Crypto
