
Sundial Growers stock: downside signals and absent news drive lower trading

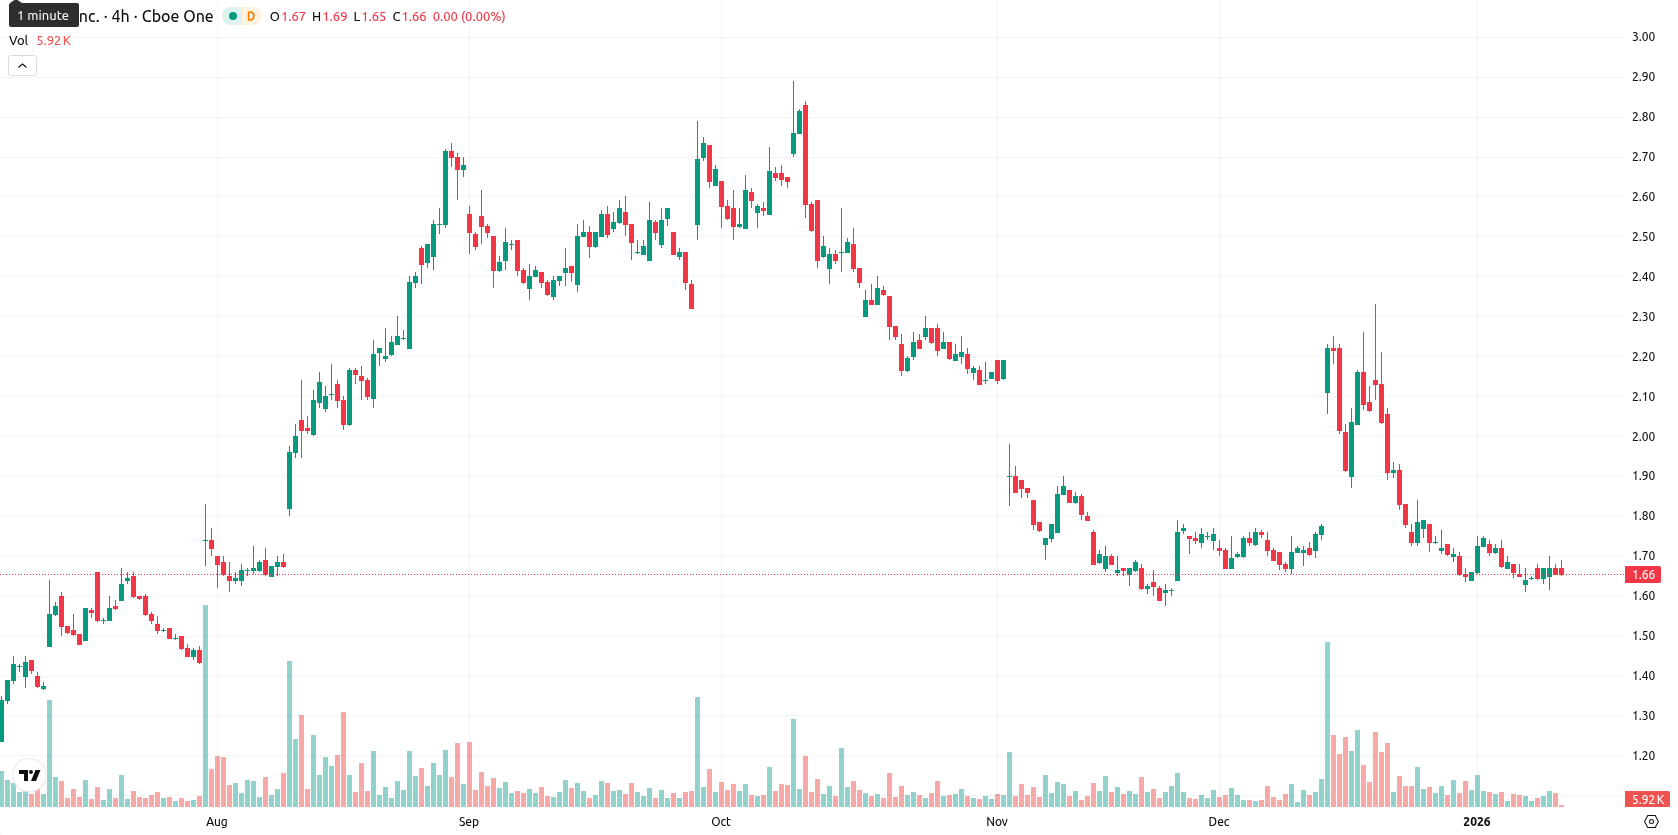
Sundial Growers Inc. (SNDL) is trading at $1.66, remaining below the MA-20 ($1.81), MA-50 ($1.79), and MA-200 ($1.78), which signals persistent selling pressure across short-, medium-, and long-term horizons. The nearest dynamic resistance is marked by the daily Ichimoku Kijun at $1.98, with no current Moving Average crossovers indicating a major trend change.
Highlights
- SNDL is trading at $1.66, remaining below the MA-20 ($1.81), MA-50 ($1.79), and MA-200 ($1.78), indicating sustained selling pressure across all time frames.
- Momentum indicators, including daily MACD, ADX below 20, and bearish Awesome Oscillator, confirm weak downside momentum and dominance by sellers intraday.
- SNDL is forecast to fluctuate between $1.60 and $1.75 over the next five sessions, with less than 20% probability of a price increase.
Subdued momentum amid weak directional trend and seller dominance
Momentum indicators show a bearish bias, with the daily MACD in a sell stance and an ADX reading below 20, pointing to a weak or non-directional trend. Daily RSI, Commodity Channel Index, and Stochastic RSI all indicate a lack of oversold or overbought extremes but lean toward weak downside momentum. Bull/Bear Power is flagged “Sell,” highlighting seller dominance intraday. The Awesome Oscillator also supports the bearish tone. There was no gap between yesterday’s close and today’s open, and the price is stuck mid-range in an extremely low volatility environment. This flat intraday action supports the theme of subdued seller pressure after the open, and intraday technicals confirm a lack of buying catalysts.
Downside favored as SNDL risks further range-bound losses
For the next five sessions, SNDL is likely to fluctuate between $1.60 and $1.75, staying within a typical volatility band relative to current levels. The probability of a price increase is very low (less than 20%), making further declines more likely in the short term. The baseline scenario is for SNDL to remain in a narrow sideways band near current levels. A bullish development would require a break above the Ichimoku resistance at $1.98, while a bearish scenario unfolds if the price falls under $1.60, with sellers maintaining control according to both daily and weekly indicator signals.
Last time, analysts noted that Sundial Growers Inc. remains under broad bearish pressure, with the current price trading below key moving averages as weak momentum and negative indicators dominate across short-, medium-, and long-term trends. While oscillators suggest the potential for a technical rebound from oversold conditions, prevailing downside signals and continued seller control favor further declines or sideways movement within a narrow range unless new catalysts emerge.


-
 Afghanistan
-
 Albania
-
 Algeria
-
 Angola
-
 Argentina
-
 Armenia
-
 Australia
-
 Austria
-
 Azerbaijan
-
 Bahamas
-
 Bahrain
-
 Bangladesh
-
 Belarus
-
 Belgium
-
 Bolivia
-
 Botswana
-
 Brazil
-
 Brunei
-
 Bulgaria
-
 Cambodia
-
 Cameroon
-
 Canada
-
 Chile
Chile
-
 China
China
-
 Colombia
-
 Congo
Congo
-
 Costa Rica
-
 Cote d'Ivoire
-
 Croatia
-
 Cuba
Cuba
-
 Cyprus
-
 Czechia
-
 DR Congo
-
 Denmark
-
 Dominican Republic
-
 Ecuador
-
 Egypt
Egypt
-
 El Salvador
-
 Estonia
-
 Eswatini
-
 Ethiopia
-
 Finland
-
 France
-
 Georgia
-
 Germany
-
 Ghana
Ghana
-
 Greece
-
 Haiti
Haiti
-
 Hong Kong
-
 Hungary
-
 India
India
-
 Indonesia
-
 Iran, Islamic republic
-
 Iraq
Iraq
-
 Ireland
-
 Israel
-
 Italy
Italy
-
 Jamaica
-
 Japan
Japan
-
 Jordan
-
 Kazakhstan
-
 Kenya
Kenya
-
 Korea
Korea
-
 Kuwait
-
 Kyrgyzstan
-
 Laos
Laos
-
 Latvia
-
 Lebanon
-
 Lesotho
-
 Libya
Libya
-
 Lithuania
-
 Luxembourg
-
 Madagascar
-
 Malaysia
-
 Malta
Malta
-
 Mauritius
-
 Mexico
-
 Moldova
-
 Mongolia
-
 Montenegro
-
 Morocco
-
 Mozambique
-
 Myanmar
-
 Namibia
-
 Nepal
Nepal
-
 Netherlands
-
 New Zealand
-
 Nigeria
-
 North Macedonia
-
 Norway
-
 Oman
Oman
-
 Pakistan
-
 Palestine
-
 Panama
-
 Papua New Guinea
-
 Paraguay
-
 Peru
Peru
-
 Philippines
-
 Poland
-
 Portugal
-
 Puerto Rico
-
 Qatar
Qatar
-
 Reunion
-
 Romania
-
 Rwanda
-
 Saudi Arabia
-
 Serbia
-
 Singapore
-
 Slovakia
-
 Slovenia
-
 Somalia
-
 South Africa
-
 Spain
Spain
-
 Sri Lanka
-
 Sweden
-
 Switzerland
-
 Syria
Syria
-
 Taiwan
-
 Tajikistan
-
 Tanzania
-
 Thailand
-
 Trinidad and Tobago
-
 Tunisia
-
 Turkey
-
 UAE
UAE
-
 Uganda
-
 Ukraine
-
 United Kingdom
-
United States
-
 Uruguay
-
 Uzbekistan
-
 Venezuela
-
 Vietnam
-
 Yemen
Yemen
-
 Zambia
-
 Zimbabwe
- Forex
- Crypto
