
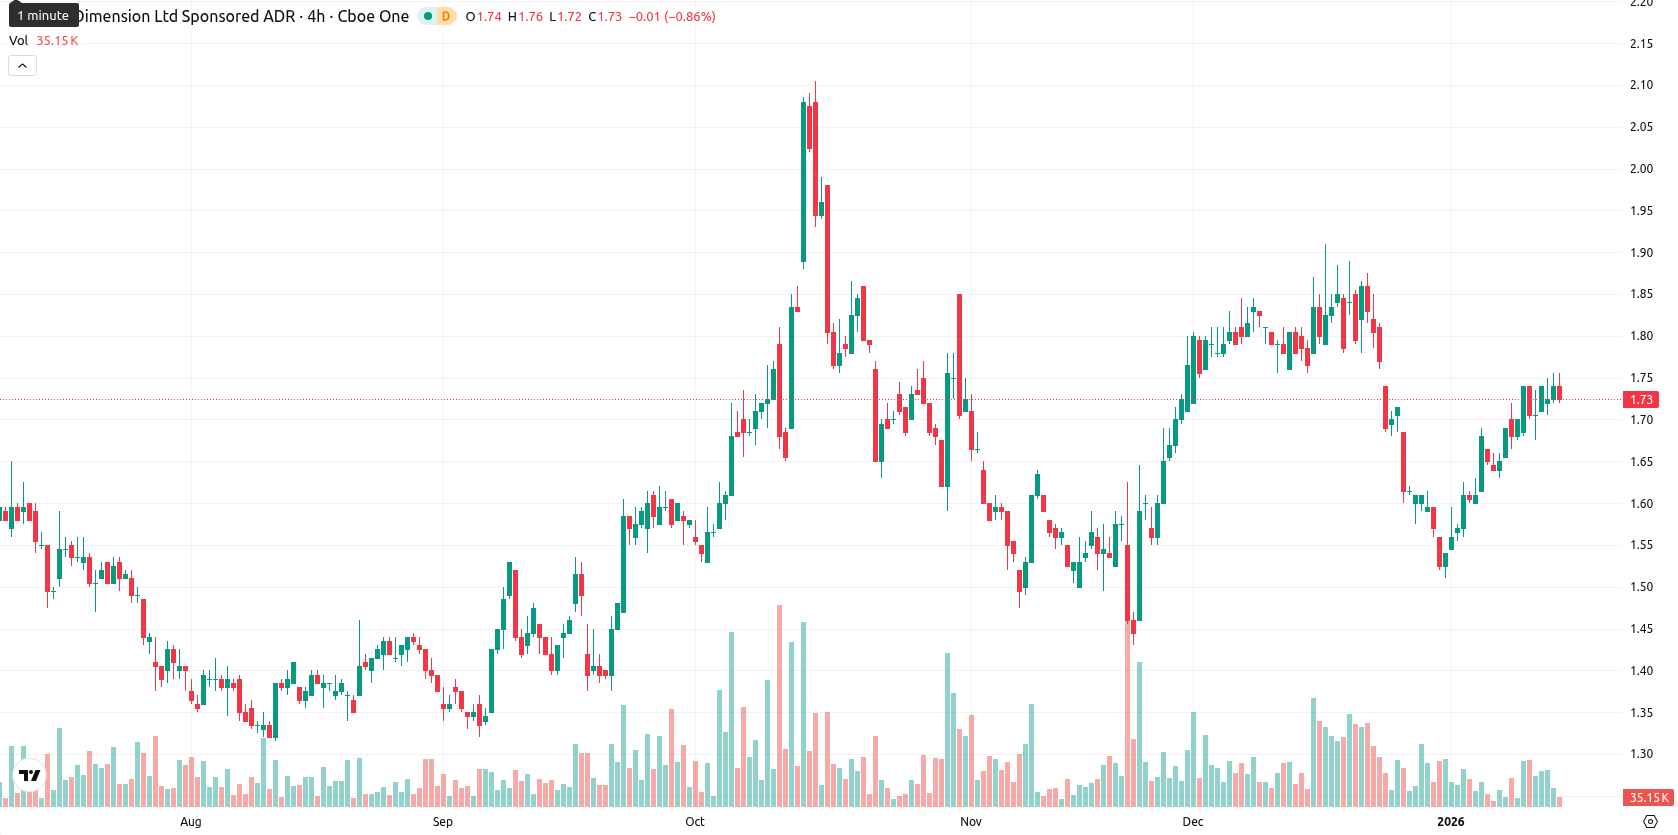
Nano Dimension stock: consolidation within $1.72–$1.79 range drives sideways trading

Nano Dimension Ltd (NNDM) is trading at $1.73, holding above the MA-20 at $1.69, MA-50 at $1.67, and well above the MA-200 at $1.57. This setup indicates a bullish bias across short-, medium-, and long-term trends, with dynamic support seen at the $1.72 Ichimoku Kijun and initial resistance near the MA-50 at $1.67 now serving as support, while the next potential cap lies at recent highs or the $1.76 round level.
Highlights
- NNDM is trading at $1.73, holding above short-, medium-, and long-term moving averages at $1.69 (MA-20), $1.67 (MA-50), and $1.57 (MA-200), indicating a bullish technical bias.
- Momentum indicators are mixed with the MACD neutral, ADX at 13.54 signaling a weak trend, and overbought conditions in the Stochastic RSI at 100, suggesting short-term exhaustion risks.
- NNDM is expected to trade sideways within a $1.72–$1.79 range over the next five sessions, with a 50% probability of upward or downward movement short-term.
Mixed momentum as overbought signals clash with steady buying
Momentum on the daily chart is mixed: the MACD signals neutrality while the ADX reading of 13.54 suggests a weak, non-directional trend. The RSI is positive at 55.55 but the daily Stochastic RSI is deeply overbought at 100, and the CCI reads as neutral; this combination warns of possible short-term exhaustion. Bull/Bear Power remains slightly positive, pointing to intraday buyer dominance, yet the price is down 0.29% from the previous close, with no gap at the open. Currently, the price sits in the mid-range of today’s $1.72 – $1.76 band, intraday volatility appears moderate, and the tone suggests sideways consolidation after modest early pressure. The divergence between overbought oscillators and buyers’ momentum may limit immediate upside and lead to short-term volatility.
Sideways outlook as volatility bands define near-term risks
Looking ahead, the expected price range for the next five trading days is $1.72 to $1.79. The probability of a price increase is 50%, whereas a decrease is just as likely in the short term. The baseline scenario sees NNDM oscillating sideways within this volatility band relative to current levels, supported by buying interest but limited upside momentum. A bullish scenario would require a decisive move above $1.76 toward $1.79, while a bearish outcome unfolds if the price breaks below dynamic support at $1.72, exposing further downside risk toward the $1.70 area.
Previously it was reported that Nano Dimension Ltd is trading above its short- and long-term moving averages, signaling ongoing bullish momentum, though mixed momentum indicators such as a strong daily MACD sell and an overbought Stochastic RSI point to short-term exhaustion. The stock is currently consolidating near resistance, with dynamic support at $1.72 and the likelihood of continued range-bound trading between $1.70 and $1.80 unless a definitive breakout occurs.


Latest Nano Dimension News


-
 Afghanistan
-
 Albania
-
 Algeria
-
 Angola
-
 Argentina
-
 Armenia
-
 Australia
-
 Austria
-
 Azerbaijan
-
 Bahamas
-
 Bahrain
-
 Bangladesh
-
 Belarus
-
 Belgium
-
 Bolivia
-
 Botswana
-
 Brazil
-
 Brunei
-
 Bulgaria
-
 Cambodia
-
 Cameroon
-
 Canada
-
 Chile
Chile
-
 China
China
-
 Colombia
-
 Congo
Congo
-
 Costa Rica
-
 Cote d'Ivoire
-
 Croatia
-
 Cuba
Cuba
-
 Cyprus
-
 Czechia
-
 DR Congo
-
 Denmark
-
 Dominican Republic
-
 Ecuador
-
 Egypt
Egypt
-
 El Salvador
-
 Estonia
-
 Eswatini
-
 Ethiopia
-
 Finland
-
 France
-
 Georgia
-
 Germany
-
 Ghana
Ghana
-
 Greece
-
 Haiti
Haiti
-
 Hong Kong
-
 Hungary
-
 India
India
-
 Indonesia
-
 Iran, Islamic republic
-
 Iraq
Iraq
-
 Ireland
-
 Israel
-
 Italy
Italy
-
 Jamaica
-
 Japan
Japan
-
 Jordan
-
 Kazakhstan
-
 Kenya
Kenya
-
 Korea
Korea
-
 Kuwait
-
 Kyrgyzstan
-
 Laos
Laos
-
 Latvia
-
 Lebanon
-
 Lesotho
-
 Libya
Libya
-
 Lithuania
-
 Luxembourg
-
 Madagascar
-
 Malaysia
-
 Malta
Malta
-
 Mauritius
-
 Mexico
-
 Moldova
-
 Mongolia
-
 Montenegro
-
 Morocco
-
 Mozambique
-
 Myanmar
-
 Namibia
-
 Nepal
Nepal
-
 Netherlands
-
 New Zealand
-
 Nigeria
-
 North Macedonia
-
 Norway
-
 Oman
Oman
-
 Pakistan
-
 Palestine
-
 Panama
-
 Papua New Guinea
-
 Paraguay
-
 Peru
Peru
-
 Philippines
-
 Poland
-
 Portugal
-
 Puerto Rico
-
 Qatar
Qatar
-
 Reunion
-
 Romania
-
 Rwanda
-
 Saudi Arabia
-
 Serbia
-
 Singapore
-
 Slovakia
-
 Slovenia
-
 Somalia
-
 South Africa
-
 Spain
Spain
-
 Sri Lanka
-
 Sweden
-
 Switzerland
-
 Syria
Syria
-
 Taiwan
-
 Tajikistan
-
 Tanzania
-
 Thailand
-
 Trinidad and Tobago
-
 Tunisia
-
 Turkey
-
 UAE
UAE
-
 Uganda
-
 Ukraine
-
 United Kingdom
-
United States
-
 Uruguay
-
 Uzbekistan
-
 Venezuela
-
 Vietnam
-
 Yemen
Yemen
-
 Zambia
-
 Zimbabwe
- Forex
- Crypto
