
Nano Dimension stock rises 3.69% as strong segment demand drives revenue higher

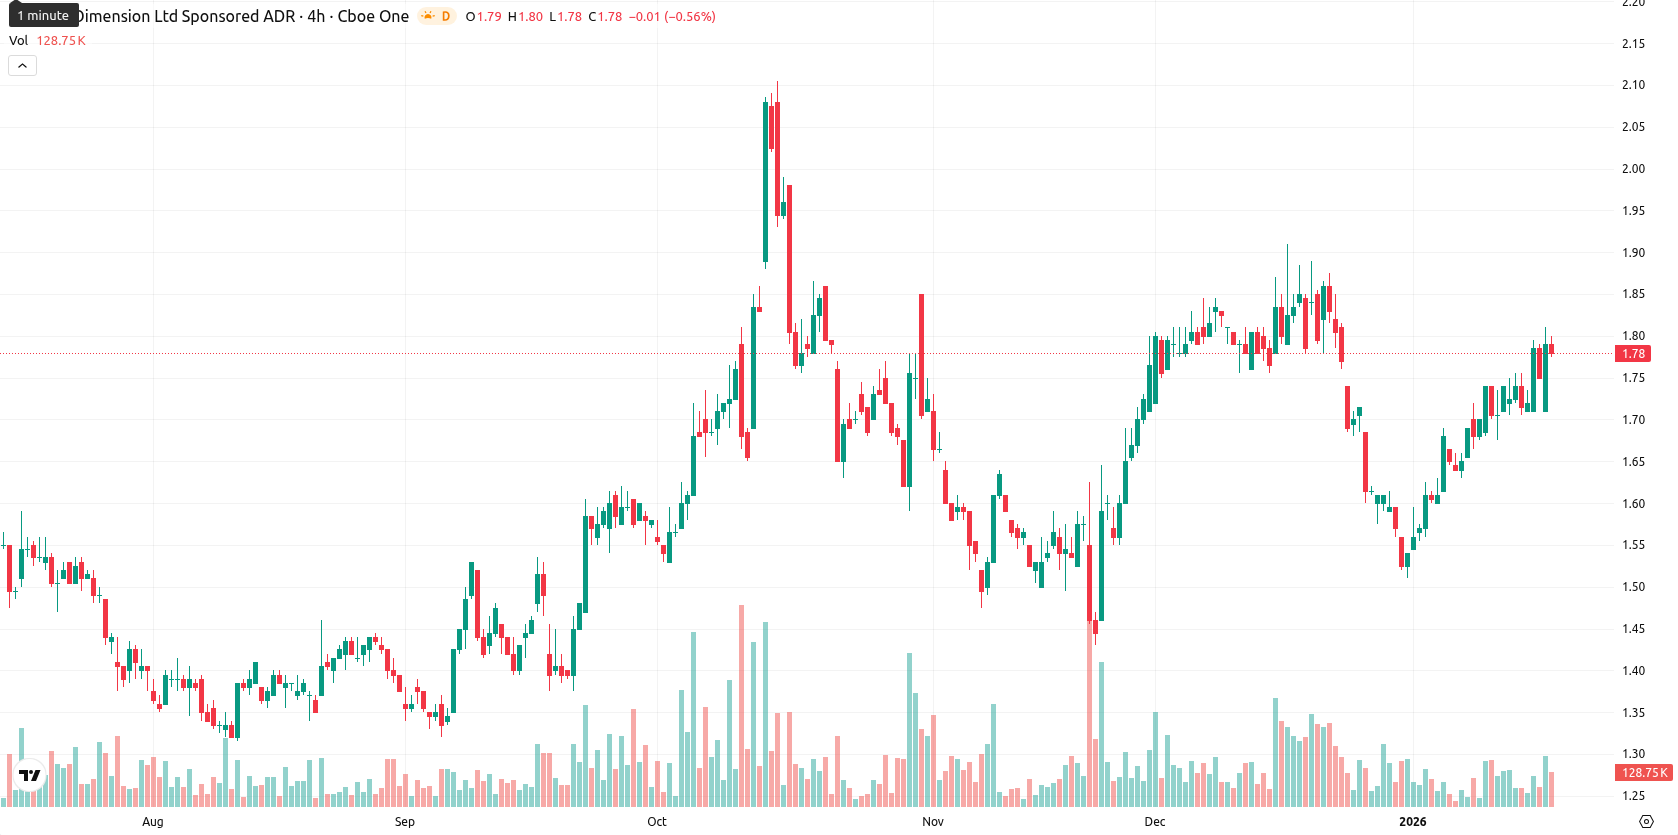
Nano Dimension Ltd (NNDM) is trading at $1.84, positioning itself above its MA-20 ($1.68), MA-50 ($1.68), and MA-200 ($1.57). This shows NNDM is maintaining a bullish structure across the short, medium, and long term, with dynamic support from the Ichimoku Kijun near $1.72 and resistance around MA-50 and the $2.00 round number.
Highlights
- Nano Dimension raised preliminary fourth quarter revenue guidance to $35.0 million–$35.5 million, exceeding its previous range of $31.5 million–$33.5 million due to strong demand in key segments.
- The company attributed its revenue outperformance to successful Markforged and Essemtec product lines and increased global engagement, especially in defense, aerospace, and next-generation networking.
- Nano Dimension reported continued advancement in its strategic alternatives review and expects to complete its redomestication process in the first half of 2026, pending standard approvals.
Preliminary revenue beats forecasts as demand grows in core segments
Nano Dimension announced preliminary, unaudited revenue for the fourth quarter of 2025 between $35.0 million and $35.5 million, exceeding earlier guidance of $31.5 million to $33.5 million due to strong demand in key segments including defense, aerospace, next-generation networking, automotive, and food & beverage. This performance was supported by the success of the Markforged and Essemtec product lines and broader global engagement. The company also reported progress on its ongoing strategic alternatives review and expects to complete its redomestication process in the first half of 2026, subject to standard approvals.
Mixed momentum signals as price rallies despite overbought risk
Momentum indicators offer a mixed picture: the MACD and ADX remain neutral and show moderate trend strength. RSI and CCI are signaling buying pressure, but the Stochastic RSI indicates overbought conditions. Bull/Bear Power demonstrates strong buying interest, while the Awesome Oscillator supports underlying bullish momentum. Price action today saw a gap down followed by recovery to the high end of the day's range, with moderate daily volatility and clear buyer strength. Some divergence between overbought oscillators and bullish momentum suggests the short-term move may be overextended.
High probability of consolidation as bullish momentum absorbs gains
For the next five trading days, the expected price range is set in a typical volatility band between $1.70 and $1.96, consistent with recent activity. The probability of an upward move remains high at 80%, while the likelihood of a decline is lower. The baseline scenario favors consolidation as bullish momentum absorbs recent gains, with resistance near $1.96 and $2.00. A drop below $1.70 could trigger a deeper retracement toward the Ichimoku Kijun and the closely clustered moving averages.
Last time, analysts noted that Nano Dimension Ltd is trading above its key moving averages and the Ichimoku Kijun, confirming bullish trends across all timeframes with the price holding near the upper end of its current range. However, mixed momentum indicators and overbought signals suggest elevated risk of a near-term pullback, with the stock expected to remain rangebound unless a decisive breakout or breakdown occurs.


Latest Nano Dimension News


-
 Afghanistan
-
 Albania
-
 Algeria
-
 Angola
-
 Argentina
-
 Armenia
-
 Australia
-
 Austria
-
 Azerbaijan
-
 Bahamas
-
 Bahrain
-
 Bangladesh
-
 Belarus
-
 Belgium
-
 Bolivia
-
 Botswana
-
 Brazil
-
 Brunei
-
 Bulgaria
-
 Cambodia
-
 Cameroon
-
 Canada
-
 Chile
Chile
-
 China
China
-
 Colombia
-
 Congo
Congo
-
 Costa Rica
-
 Cote d'Ivoire
-
 Croatia
-
 Cuba
Cuba
-
 Cyprus
-
 Czechia
-
 DR Congo
-
 Denmark
-
 Dominican Republic
-
 Ecuador
-
 Egypt
Egypt
-
 El Salvador
-
 Estonia
-
 Eswatini
-
 Ethiopia
-
 Finland
-
 France
-
 Georgia
-
 Germany
-
 Ghana
Ghana
-
 Greece
-
 Haiti
Haiti
-
 Hong Kong
-
 Hungary
-
 India
India
-
 Indonesia
-
 Iran, Islamic republic
-
 Iraq
Iraq
-
 Ireland
-
 Israel
-
 Italy
Italy
-
 Jamaica
-
 Japan
Japan
-
 Jordan
-
 Kazakhstan
-
 Kenya
Kenya
-
 Korea
Korea
-
 Kuwait
-
 Kyrgyzstan
-
 Laos
Laos
-
 Latvia
-
 Lebanon
-
 Lesotho
-
 Libya
Libya
-
 Lithuania
-
 Luxembourg
-
 Madagascar
-
 Malaysia
-
 Malta
Malta
-
 Mauritius
-
 Mexico
-
 Moldova
-
 Mongolia
-
 Montenegro
-
 Morocco
-
 Mozambique
-
 Myanmar
-
 Namibia
-
 Nepal
Nepal
-
 Netherlands
-
 New Zealand
-
 Nigeria
-
 North Macedonia
-
 Norway
-
 Oman
Oman
-
 Pakistan
-
 Palestine
-
 Panama
-
 Papua New Guinea
-
 Paraguay
-
 Peru
Peru
-
 Philippines
-
 Poland
-
 Portugal
-
 Puerto Rico
-
 Qatar
Qatar
-
 Reunion
-
 Romania
-
 Rwanda
-
 Saudi Arabia
-
 Serbia
-
 Singapore
-
 Slovakia
-
 Slovenia
-
 Somalia
-
 South Africa
-
 Spain
Spain
-
 Sri Lanka
-
 Sweden
-
 Switzerland
-
 Syria
Syria
-
 Taiwan
-
 Tajikistan
-
 Tanzania
-
 Thailand
-
 Trinidad and Tobago
-
 Tunisia
-
 Turkey
-
 UAE
UAE
-
 Uganda
-
 Ukraine
-
 United Kingdom
-
United States
-
 Uruguay
-
 Uzbekistan
-
 Venezuela
-
 Vietnam
-
 Yemen
Yemen
-
 Zambia
-
 Zimbabwe
- Forex
- Crypto
