
Technical weakness persists — Bit Digital stock slips 3.14%

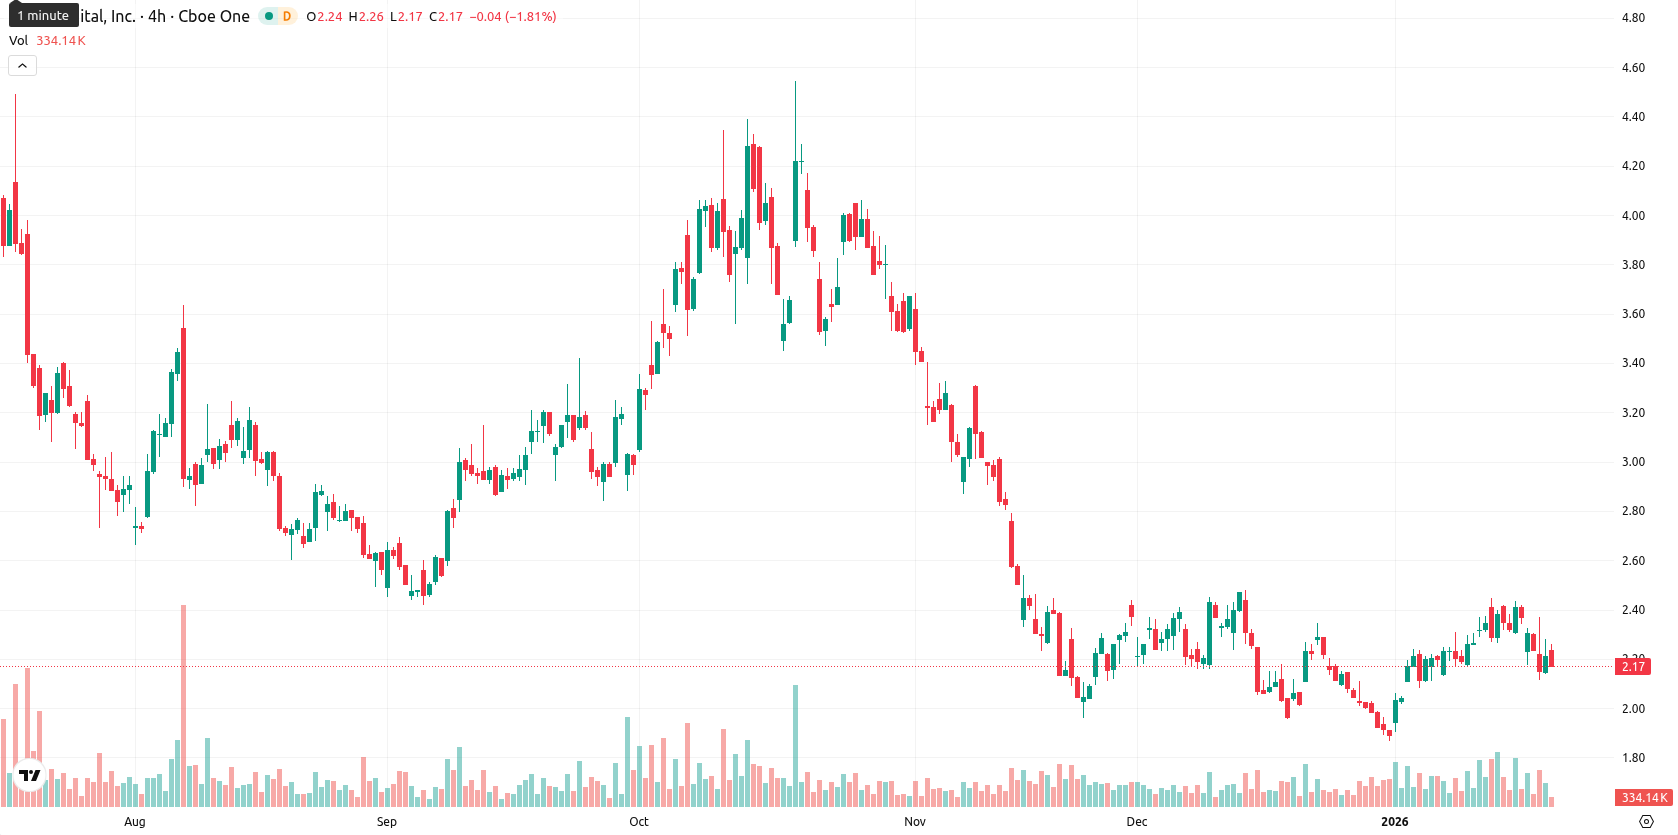
Bit Digital Inc (BTBT) is trading at $2.16, currently below its MA-20 ($2.18), MA-50 ($2.28), and MA-200 ($2.69). This positioning confirms ongoing short-, medium-, and long-term downside pressure, with sellers dominating across all major trend horizons.
Highlights
- BTBT trades at $2.16, below its MA-20 ($2.18), MA-50 ($2.28), and MA-200 ($2.69), confirming multi-horizon downside pressure.
- Momentum indicators including MACD, ADX, RSI, and CCI remain weak or negative, with the Awesome Oscillator neutral, signaling an absence of bullish triggers.
- The price dropped 3.14% today, with trading expected between $2.05 and $2.32 over the next five sessions barring a break above $2.28 or below $2.05.
Weak momentum and neutral signals as support and resistance converge
The nearest dynamic support is around the Ichimoku Kijun at $2.17, while resistance is seen at the MA-50 near $2.28. Momentum signals on the daily chart are generally weak, with both MACD and ADX indicating a lack of strong directional drive. RSI and CCI both suggest mild selling pressure without steep oversold signals, while the Stochastic RSI remains neutral. Bull/Bear Power is slightly positive, hinting at marginal buyer presence in the intraday session, but this is not strong enough to shift the bearish tone. The Awesome Oscillator reads neutral and does not reinforce the prevailing direction.
Further downside favored as upside probability remains low
Over the next five trading days, the expected price range is $2.05 to $2.32, reflecting a typical volatility band relative to current levels. Indicators on both daily and weekly timeframes show a clear absence of bullish triggers, with all major signals including RSI, MACD, and every weekly Moving Average on a "Sell" classification, so there is a very low probability (less than 20%) of an upside break, making a further decline more likely. The baseline scenario is continued sideways trading between recent lows and resistance. A bullish scenario could be triggered on a move above $2.28, while a drop below $2.05 may encourage another wave of selling.
Previously it was reported that Bit Digital Inc. is trading below its short-, medium-, and long-term moving averages, with persistent downside pressure evident across technical indicators, including a neutral-to-bearish momentum profile and bearish oscillators such as RSI and Stoch RSI. The near-term outlook remains cautious as resistance holds at multiple moving averages, volatility remains elevated, and the probability of a sustained rebound is low, with the price expected to stay within a tight range unless decisive buying emerges.


Latest Bit Digital News


-
 Afghanistan
-
 Albania
-
 Algeria
-
 Angola
-
 Argentina
-
 Armenia
-
 Australia
-
 Austria
-
 Azerbaijan
-
 Bahamas
-
 Bahrain
-
 Bangladesh
-
 Belarus
-
 Belgium
-
 Bolivia
-
 Botswana
-
 Brazil
-
 Brunei
-
 Bulgaria
-
 Cambodia
-
 Cameroon
-
 Canada
-
 Chile
Chile
-
 China
China
-
 Colombia
-
 Congo
Congo
-
 Costa Rica
-
 Cote d'Ivoire
-
 Croatia
-
 Cuba
Cuba
-
 Cyprus
-
 Czechia
-
 DR Congo
-
 Denmark
-
 Dominican Republic
-
 Ecuador
-
 Egypt
Egypt
-
 El Salvador
-
 Estonia
-
 Eswatini
-
 Ethiopia
-
 Finland
-
 France
-
 Georgia
-
 Germany
-
 Ghana
Ghana
-
 Greece
-
 Haiti
Haiti
-
 Hong Kong
-
 Hungary
-
 India
India
-
 Indonesia
-
 Iran, Islamic republic
-
 Iraq
Iraq
-
 Ireland
-
 Israel
-
 Italy
Italy
-
 Jamaica
-
 Japan
Japan
-
 Jordan
-
 Kazakhstan
-
 Kenya
Kenya
-
 Korea
Korea
-
 Kuwait
-
 Kyrgyzstan
-
 Laos
Laos
-
 Latvia
-
 Lebanon
-
 Lesotho
-
 Libya
Libya
-
 Lithuania
-
 Luxembourg
-
 Madagascar
-
 Malaysia
-
 Malta
Malta
-
 Mauritius
-
 Mexico
-
 Moldova
-
 Mongolia
-
 Montenegro
-
 Morocco
-
 Mozambique
-
 Myanmar
-
 Namibia
-
 Nepal
Nepal
-
 Netherlands
-
 New Zealand
-
 Nigeria
-
 North Macedonia
-
 Norway
-
 Oman
Oman
-
 Pakistan
-
 Palestine
-
 Panama
-
 Papua New Guinea
-
 Paraguay
-
 Peru
Peru
-
 Philippines
-
 Poland
-
 Portugal
-
 Puerto Rico
-
 Qatar
Qatar
-
 Reunion
-
 Romania
-
 Rwanda
-
 Saudi Arabia
-
 Serbia
-
 Singapore
-
 Slovakia
-
 Slovenia
-
 Somalia
-
 South Africa
-
 Spain
Spain
-
 Sri Lanka
-
 Sweden
-
 Switzerland
-
 Syria
Syria
-
 Taiwan
-
 Tajikistan
-
 Tanzania
-
 Thailand
-
 Trinidad and Tobago
-
 Tunisia
-
 Turkey
-
 UAE
UAE
-
 Uganda
-
 Ukraine
-
 United Kingdom
-
United States
-
 Uruguay
-
 Uzbekistan
-
 Venezuela
-
 Vietnam
-
 Yemen
Yemen
-
 Zambia
-
 Zimbabwe
- Forex
- Crypto
