
Globalstar stock rises 4.83% as bullish technicals overshadow mixed momentum signals

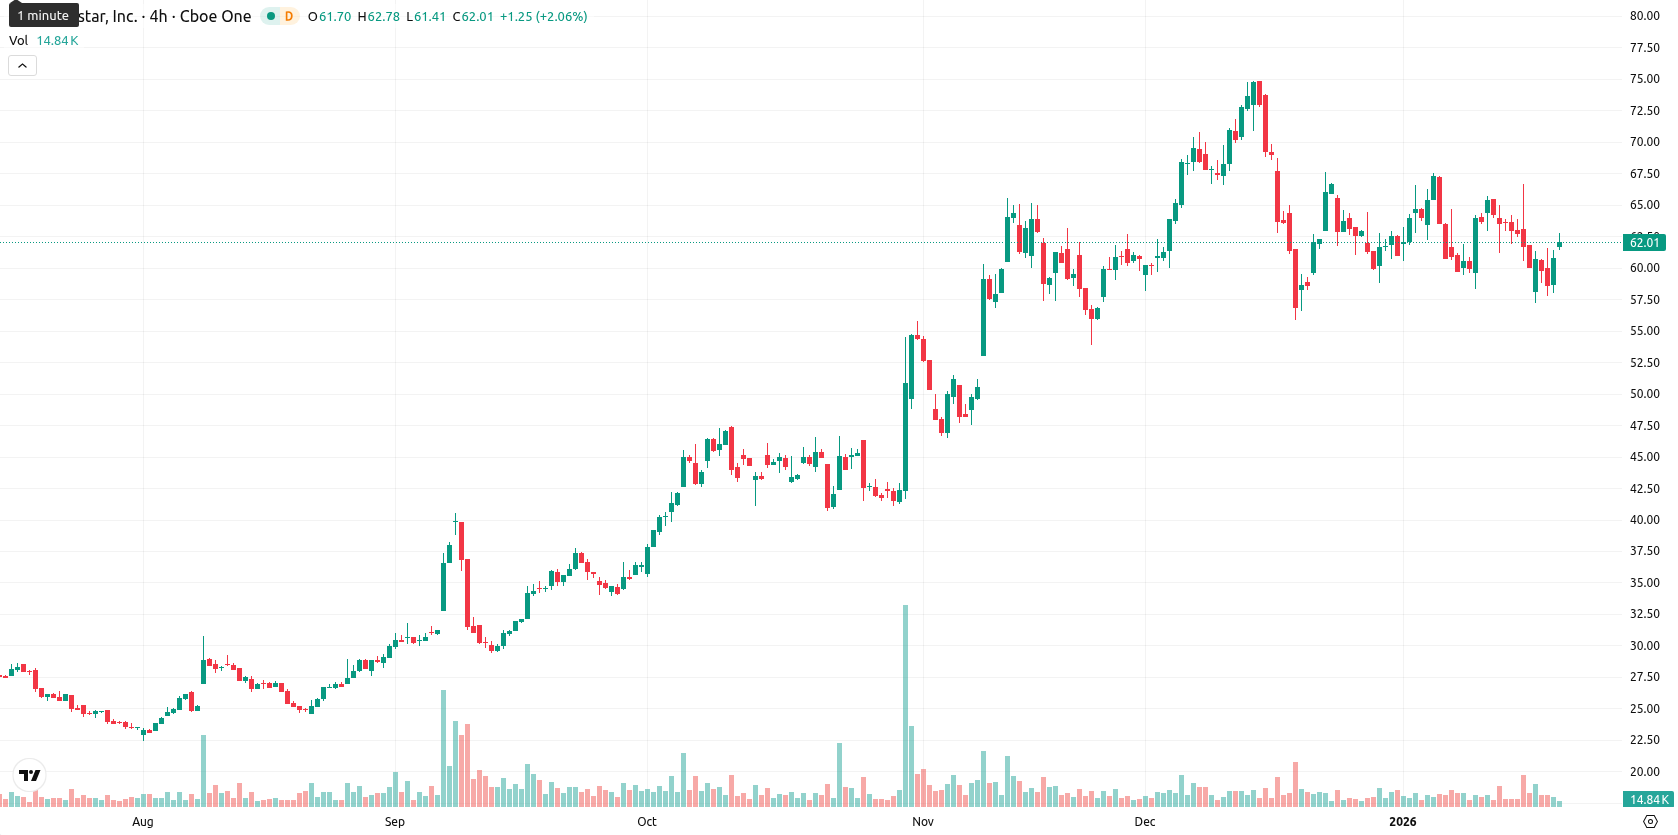
Globalstar, Inc. (GSAT) is currently trading at $63.75, posting a daily gain of $2.94 or 4.83%. The price stands above the MA-20 ($62.52) and MA-50 ($62.62), underscoring short-term and medium-term strength, while a clear distance from the MA-200 ($36.84) supports a bullish long-term trend.
Highlights
- SG Americas Securities LLC established a new position in Globalstar during the third quarter, acquiring 19,589 shares as reported in its recent Form 13F filing.
- This SEC disclosure indicates rising institutional interest in Globalstar, with SG Americas Securities LLC making a notable investment move.
- The transaction was publicly revealed in the firm's latest SEC filing, drawing attention from professional investors monitoring shifts in institutional ownership.
Institutional buying expands as SG Americas Securities reports stake increase
SG Americas Securities LLC disclosed a new position in Globalstar during the third quarter, acquiring 19,589 shares as reflected in its recent SEC Form 13F filing. This transaction signals increased institutional interest in Globalstar shares.
Bearish momentum persists despite price nearing resistance and oversold signals
From a technical standpoint, the nearest resistance is located around $62.62 (MA-50), while dynamic support emerges near $65.33, marked by the Ichimoku Kijun line. Momentum signals are mixed: the MACD is in a sell mode on the daily chart and the ADX reading of 18.67 points to a weak, non-trending environment. Oscillators indicate oversold conditions, with the RSI at 47.31 (bearish), Stochastic RSI deeply oversold at 15.86, CCI oversold at -126.40, and Bull/Bear Power also oversold at -0.49, showing seller dominance in intraday trading. Despite these bearish indicators, GSAT's high intraday volatility and movement near today's highs reflect a divergence between price action and momentum signals.
Further gains favored as volatility supports upward breakout scenario
Over the next five days, typical volatility places the expected price range for GSAT between $57.00 and $66.50. There is a high probability (above 80%) of further gains, with a low chance of decline given prevailing bullish trends. The base case points to consolidation within the $57.00 – $66.50 band, while a strong breakout above $66.50 could trigger additional upside. Downside risk is limited and would only increase if there is a decisive drop below $57.00, which is less likely in the current environment.
Last time, analysts noted that Globalstar Inc. (GSAT) was trading just above its 20-day moving average and significantly above both its 50-day and 200-day averages, signaling sustained strength above key support levels but facing mild short-term resistance near the Ichimoku Kijun line. Momentum signals remain mixed with neutral MACD, modestly bullish ADX, and broadly oversold oscillators, while intraday price action is strong despite underlying indicators suggesting persistent selling pressure.


Latest Globalstar News


-
 Afghanistan
-
 Albania
-
 Algeria
-
 Angola
-
 Argentina
-
 Armenia
-
 Australia
-
 Austria
-
 Azerbaijan
-
 Bahamas
-
 Bahrain
-
 Bangladesh
-
 Belarus
-
 Belgium
-
 Bolivia
-
 Botswana
-
 Brazil
-
 Brunei
-
 Bulgaria
-
 Cambodia
-
 Cameroon
-
 Canada
-
 Chile
Chile
-
 China
China
-
 Colombia
-
 Congo
Congo
-
 Costa Rica
-
 Cote d'Ivoire
-
 Croatia
-
 Cuba
Cuba
-
 Cyprus
-
 Czechia
-
 DR Congo
-
 Denmark
-
 Dominican Republic
-
 Ecuador
-
 Egypt
Egypt
-
 El Salvador
-
 Estonia
-
 Eswatini
-
 Ethiopia
-
 Finland
-
 France
-
 Georgia
-
 Germany
-
 Ghana
Ghana
-
 Greece
-
 Haiti
Haiti
-
 Hong Kong
-
 Hungary
-
 India
India
-
 Indonesia
-
 Iran, Islamic republic
-
 Iraq
Iraq
-
 Ireland
-
 Israel
-
 Italy
Italy
-
 Jamaica
-
 Japan
Japan
-
 Jordan
-
 Kazakhstan
-
 Kenya
Kenya
-
 Korea
Korea
-
 Kuwait
-
 Kyrgyzstan
-
 Laos
Laos
-
 Latvia
-
 Lebanon
-
 Lesotho
-
 Libya
Libya
-
 Lithuania
-
 Luxembourg
-
 Madagascar
-
 Malaysia
-
 Malta
Malta
-
 Mauritius
-
 Mexico
-
 Moldova
-
 Mongolia
-
 Montenegro
-
 Morocco
-
 Mozambique
-
 Myanmar
-
 Namibia
-
 Nepal
Nepal
-
 Netherlands
-
 New Zealand
-
 Nigeria
-
 North Macedonia
-
 Norway
-
 Oman
Oman
-
 Pakistan
-
 Palestine
-
 Panama
-
 Papua New Guinea
-
 Paraguay
-
 Peru
Peru
-
 Philippines
-
 Poland
-
 Portugal
-
 Puerto Rico
-
 Qatar
Qatar
-
 Reunion
-
 Romania
-
 Rwanda
-
 Saudi Arabia
-
 Serbia
-
 Singapore
-
 Slovakia
-
 Slovenia
-
 Somalia
-
 South Africa
-
 Spain
Spain
-
 Sri Lanka
-
 Sweden
-
 Switzerland
-
 Syria
Syria
-
 Taiwan
-
 Tajikistan
-
 Tanzania
-
 Thailand
-
 Trinidad and Tobago
-
 Tunisia
-
 Turkey
-
 UAE
UAE
-
 Uganda
-
 Ukraine
-
 United Kingdom
-
United States
-
 Uruguay
-
 Uzbekistan
-
 Venezuela
-
 Vietnam
-
 Yemen
Yemen
-
 Zambia
-
 Zimbabwe
- Forex
- Crypto
