
Affirm stock drops 3.13% as technical signals suggest sellers dominate near key support

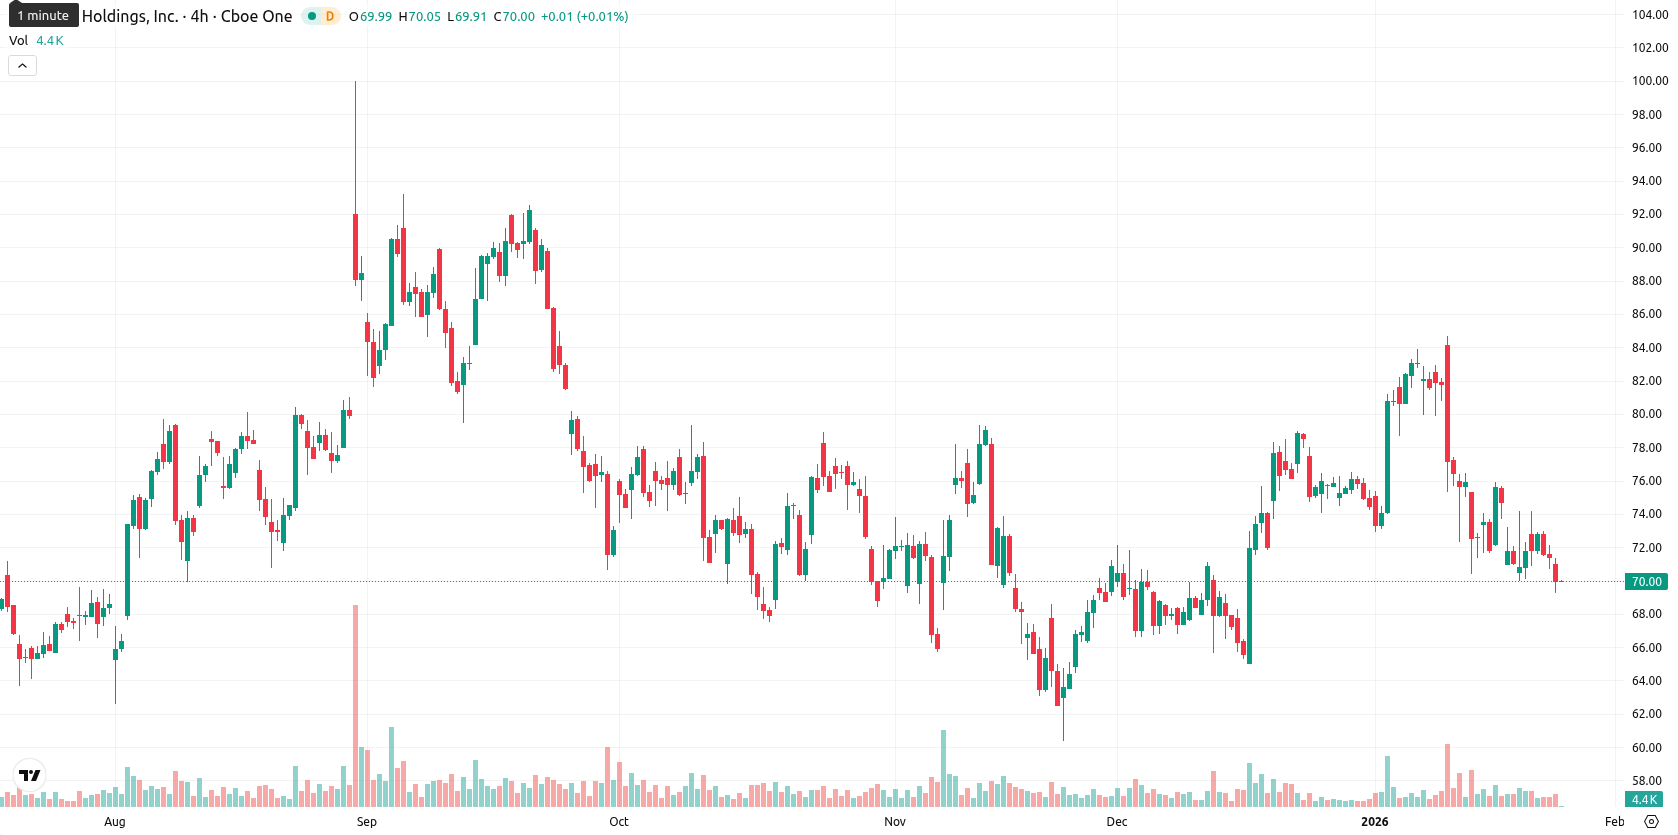
Affirm Holdings, Inc. (AFRM) is trading at $69.20, below both the MA-20 at $75.99 and the MA-50 at $72.46, but just above the MA-200 at $68.14. This positioning signals clear short- and medium-term selling pressure with longer-term trend support near $68.
Highlights
- Affirm (AFRM) is trading at $69.20, below the MA-20 ($75.99) and MA-50 ($72.46), signaling ongoing short- and medium-term selling pressure.
- Technical momentum is weak, with MACD neutral, ADX low, RSI bearish, and oversold signals from Stochastic RSI and CCI indicating risk of a near-term bounce despite strong sellers.
- For the coming week, expected trading range is $67.00–$71.00, with less than 20% probability of a bullish breakout above $74.78 and MA-200 at $68.14 serving as critical support.
Fiserv partnership expands Affirm access across debit card networks
Affirm has entered an exclusive collaboration with Fiserv, Inc. to integrate its buy now, pay later solution into debit card programs for U.S. financial institutions. This partnership will enable thousands of banks and credit unions to offer Affirm's installment payment options to debit cardholders, granting access to nearly 420,000 merchants. The rollout aims to deepen customer engagement and enhance flexibility in debit products through an in-app feature for converting transactions into installment loans.
Weak momentum prevails as oversold signals clash with bearish bias
Momentum for AFRM is weak, as the MACD is neutral and the ADX signals low trend strength, while the RSI also leans bearish. The price action is dominated by sellers, with both Bull/Bear Power and the Awesome Oscillator reinforcing the downtrend. Stochastic RSI and CCI highlight oversold conditions, which, alongside continued intraday selling, suggest a potential for a short-term bounce, although sellers are firmly in control. Key technical levels include immediate resistance at the Ichimoku Kijun ($74.78) and support at the MA-200 ($68.14).
Sideways or downward move likely amid low reversal odds
In the short term, Affirm is expected to trade within a typical volatility band of $67.00 to $71.00, reflecting recent price fluctuations. The probability of a further upward move is low (below 20%), so a downside or sideways consolidation scenario is more likely. If the price can break above $74.78, a bullish reversal may develop, but renewed downside could see support tested near $68.00 at the MA-200.
Previously it was reported that Affirm Holdings, Inc. continues to trade below short- and medium-term moving averages but remains above key long-term supports, signaling lingering near-term weakness within an overall constructive trend. While momentum indicators approach oversold conditions and oscillators remain negative, a bullish breakout is likely if resistance near $75 is breached, though current sentiment favors sideways consolidation between support at $72.50 and resistance at $75.00.


Latest Affirm News


-
 Afghanistan
-
 Albania
-
 Algeria
-
 Angola
-
 Argentina
-
 Armenia
-
 Australia
-
 Austria
-
 Azerbaijan
-
 Bahamas
-
 Bahrain
-
 Bangladesh
-
 Belarus
-
 Belgium
-
 Bolivia
-
 Botswana
-
 Brazil
-
 Brunei
-
 Bulgaria
-
 Cambodia
-
 Cameroon
-
 Canada
-
 Chile
Chile
-
 China
China
-
 Colombia
-
 Congo
Congo
-
 Costa Rica
-
 Cote d'Ivoire
-
 Croatia
-
 Cuba
Cuba
-
 Cyprus
-
 Czechia
-
 DR Congo
-
 Denmark
-
 Dominican Republic
-
 Ecuador
-
 Egypt
Egypt
-
 El Salvador
-
 Estonia
-
 Eswatini
-
 Ethiopia
-
 Finland
-
 France
-
 Georgia
-
 Germany
-
 Ghana
Ghana
-
 Greece
-
 Haiti
Haiti
-
 Hong Kong
-
 Hungary
-
 India
India
-
 Indonesia
-
 Iran, Islamic republic
-
 Iraq
Iraq
-
 Ireland
-
 Israel
-
 Italy
Italy
-
 Jamaica
-
 Japan
Japan
-
 Jordan
-
 Kazakhstan
-
 Kenya
Kenya
-
 Korea
Korea
-
 Kuwait
-
 Kyrgyzstan
-
 Laos
Laos
-
 Latvia
-
 Lebanon
-
 Lesotho
-
 Libya
Libya
-
 Lithuania
-
 Luxembourg
-
 Madagascar
-
 Malaysia
-
 Malta
Malta
-
 Mauritius
-
 Mexico
-
 Moldova
-
 Mongolia
-
 Montenegro
-
 Morocco
-
 Mozambique
-
 Myanmar
-
 Namibia
-
 Nepal
Nepal
-
 Netherlands
-
 New Zealand
-
 Nigeria
-
 North Macedonia
-
 Norway
-
 Oman
Oman
-
 Pakistan
-
 Palestine
-
 Panama
-
 Papua New Guinea
-
 Paraguay
-
 Peru
Peru
-
 Philippines
-
 Poland
-
 Portugal
-
 Puerto Rico
-
 Qatar
Qatar
-
 Reunion
-
 Romania
-
 Rwanda
-
 Saudi Arabia
-
 Serbia
-
 Singapore
-
 Slovakia
-
 Slovenia
-
 Somalia
-
 South Africa
-
 Spain
Spain
-
 Sri Lanka
-
 Sweden
-
 Switzerland
-
 Syria
Syria
-
 Taiwan
-
 Tajikistan
-
 Tanzania
-
 Thailand
-
 Trinidad and Tobago
-
 Tunisia
-
 Turkey
-
 UAE
UAE
-
 Uganda
-
 Ukraine
-
 United Kingdom
-
United States
-
 Uruguay
-
 Uzbekistan
-
 Venezuela
-
 Vietnam
-
 Yemen
Yemen
-
 Zambia
-
 Zimbabwe
- Forex
- Crypto
