
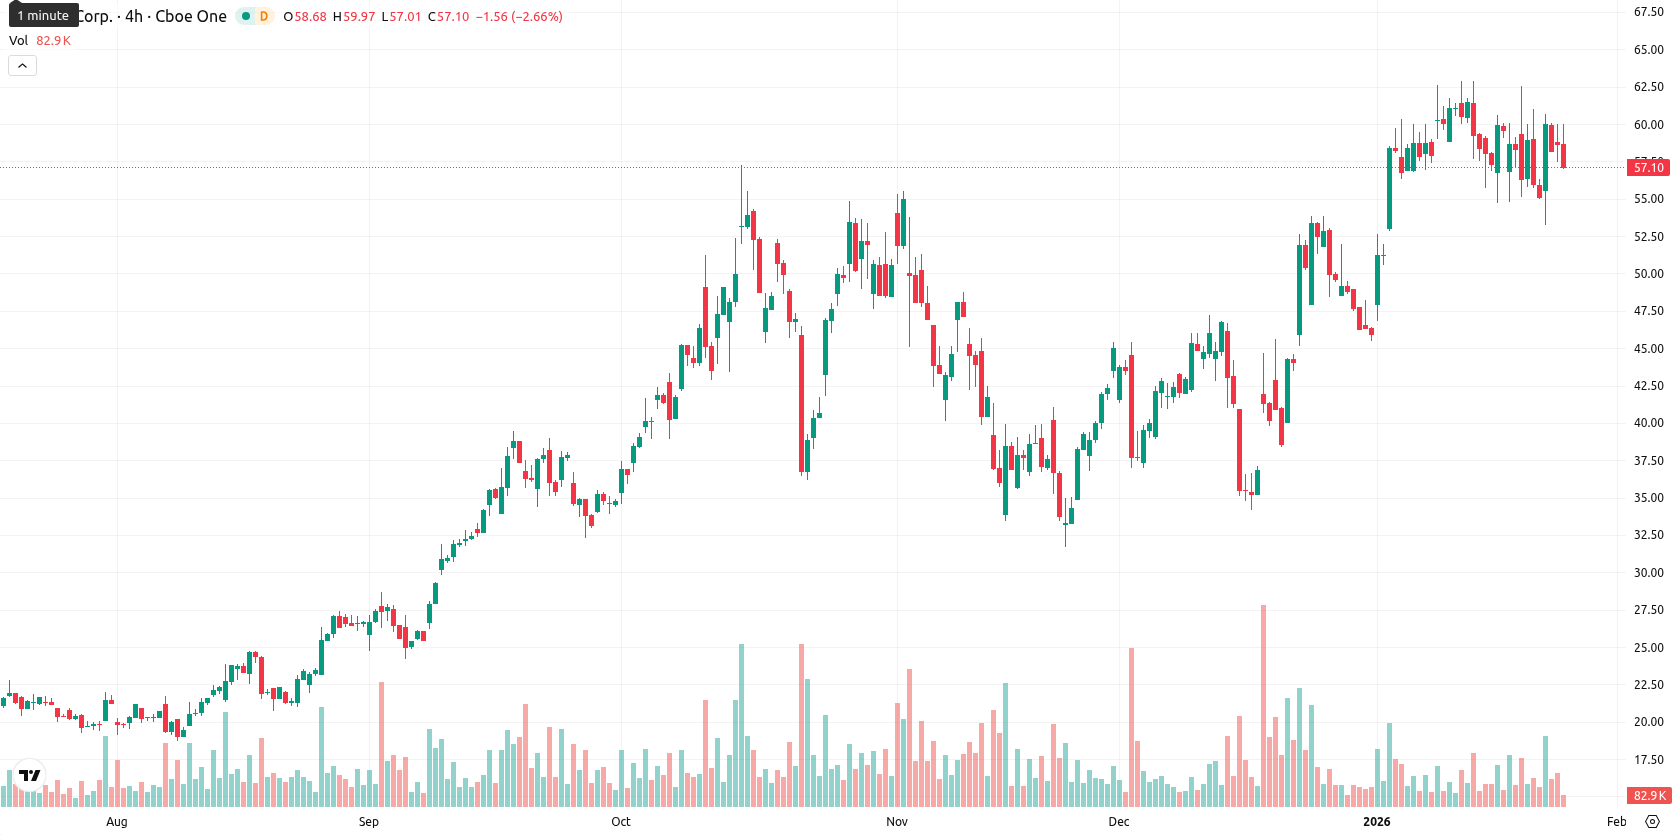
Hut 8 stock price forecast: Broad bullish momentum as HUT declines 3.16% to $56.38

Hut 8 Corp (HUT) is trading at $56.38 after a 3.16% drop for the day, down $1.84. The price remains above the MA-20 ($55.78), MA-50 ($46.99), and MA-200 ($30.92), signaling continued strong short- and long-term bullish momentum.
Highlights
- HUT is trading at $56.38, above its MA-20 ($55.78), MA-50 ($46.99), and MA-200 ($30.92), demonstrating strong short- and long-term bullish momentum.
- The Ichimoku Kijun at $48.55 acts as dynamic support, with key price boundaries set at $54.00 (support) and $60.00 (psychological resistance) for the next five days.
- Technical signals remain largely bullish despite today's 3.16% decline, with momentum indicators mixed; probability of price increase exceeds 80%, implying upside bias between $54.00 and $60.00.
Mixed oscillator signals as daily momentum remains firm
Momentum on the daily chart is positive, with the MACD remaining firmly in buy mode and the ADX neutral, suggesting a developing but not robust trend yet. The nearest dynamic support is the Ichimoku Kijun at $48.55, and resistance appears at the psychological $60 mark. The RSI remains bullish but below overbought territory, while the Stochastic RSI gives a strong buy reading. The CCI is neutral, and Bull/Bear Power shows an overbought state — buyers are currently dominant though further upside may be stretched; oscillators are mixed, with today's drop partly contradicting ongoing bullish momentum.
Limited downside risk as range constrains short-term outlook
For the next five trading days, HUT is expected to fluctuate between $54.00 and $60.00, which defines the typical volatility band relative to current levels. The probability of a price increase is high, exceeding 80%, thus further downside seems limited. The baseline scenario is sideways trading between $54.00 and $60.00. A move above $60.00 could trigger an acceleration upwards, while a decline below $54.00 may prompt deeper corrective action, with longer-term weekly indicators expected to provide underlying support.
Previously it was reported that Hut 8 Corp is exhibiting strong bullish momentum, trading well above its key moving averages, with technical indicators showing mixed momentum as it approaches resistance amid heightened volatility. While MACD remains bullish and RSI is positive, divergence among oscillators and overbought signals suggest possible near-term exhaustion, though medium-term support remains robust.


Latest Hut 8 News


-
 Afghanistan
-
 Albania
-
 Algeria
-
 Angola
-
 Argentina
-
 Armenia
-
 Australia
-
 Austria
-
 Azerbaijan
-
 Bahamas
-
 Bahrain
-
 Bangladesh
-
 Belarus
-
 Belgium
-
 Bolivia
-
 Botswana
-
 Brazil
-
 Brunei
-
 Bulgaria
-
 Cambodia
-
 Cameroon
-
 Canada
-
 Chile
Chile
-
 China
China
-
 Colombia
-
 Congo
Congo
-
 Costa Rica
-
 Cote d'Ivoire
-
 Croatia
-
 Cuba
Cuba
-
 Cyprus
-
 Czechia
-
 DR Congo
-
 Denmark
-
 Dominican Republic
-
 Ecuador
-
 Egypt
Egypt
-
 El Salvador
-
 Estonia
-
 Eswatini
-
 Ethiopia
-
 Finland
-
 France
-
 Georgia
-
 Germany
-
 Ghana
Ghana
-
 Greece
-
 Haiti
Haiti
-
 Hong Kong
-
 Hungary
-
 India
India
-
 Indonesia
-
 Iran, Islamic republic
-
 Iraq
Iraq
-
 Ireland
-
 Israel
-
 Italy
Italy
-
 Jamaica
-
 Japan
Japan
-
 Jordan
-
 Kazakhstan
-
 Kenya
Kenya
-
 Korea
Korea
-
 Kuwait
-
 Kyrgyzstan
-
 Laos
Laos
-
 Latvia
-
 Lebanon
-
 Lesotho
-
 Libya
Libya
-
 Lithuania
-
 Luxembourg
-
 Madagascar
-
 Malaysia
-
 Malta
Malta
-
 Mauritius
-
 Mexico
-
 Moldova
-
 Mongolia
-
 Montenegro
-
 Morocco
-
 Mozambique
-
 Myanmar
-
 Namibia
-
 Nepal
Nepal
-
 Netherlands
-
 New Zealand
-
 Nigeria
-
 North Macedonia
-
 Norway
-
 Oman
Oman
-
 Pakistan
-
 Palestine
-
 Panama
-
 Papua New Guinea
-
 Paraguay
-
 Peru
Peru
-
 Philippines
-
 Poland
-
 Portugal
-
 Puerto Rico
-
 Qatar
Qatar
-
 Reunion
-
 Romania
-
 Rwanda
-
 Saudi Arabia
-
 Serbia
-
 Singapore
-
 Slovakia
-
 Slovenia
-
 Somalia
-
 South Africa
-
 Spain
Spain
-
 Sri Lanka
-
 Sweden
-
 Switzerland
-
 Syria
Syria
-
 Taiwan
-
 Tajikistan
-
 Tanzania
-
 Thailand
-
 Trinidad and Tobago
-
 Tunisia
-
 Turkey
-
 UAE
UAE
-
 Uganda
-
 Ukraine
-
 United Kingdom
-
United States
-
 Uruguay
-
 Uzbekistan
-
 Venezuela
-
 Vietnam
-
 Yemen
Yemen
-
 Zambia
-
 Zimbabwe
- Forex
- Crypto
