
JetBlue Airways stock falls after disappointing Q4 earnings and guidance update

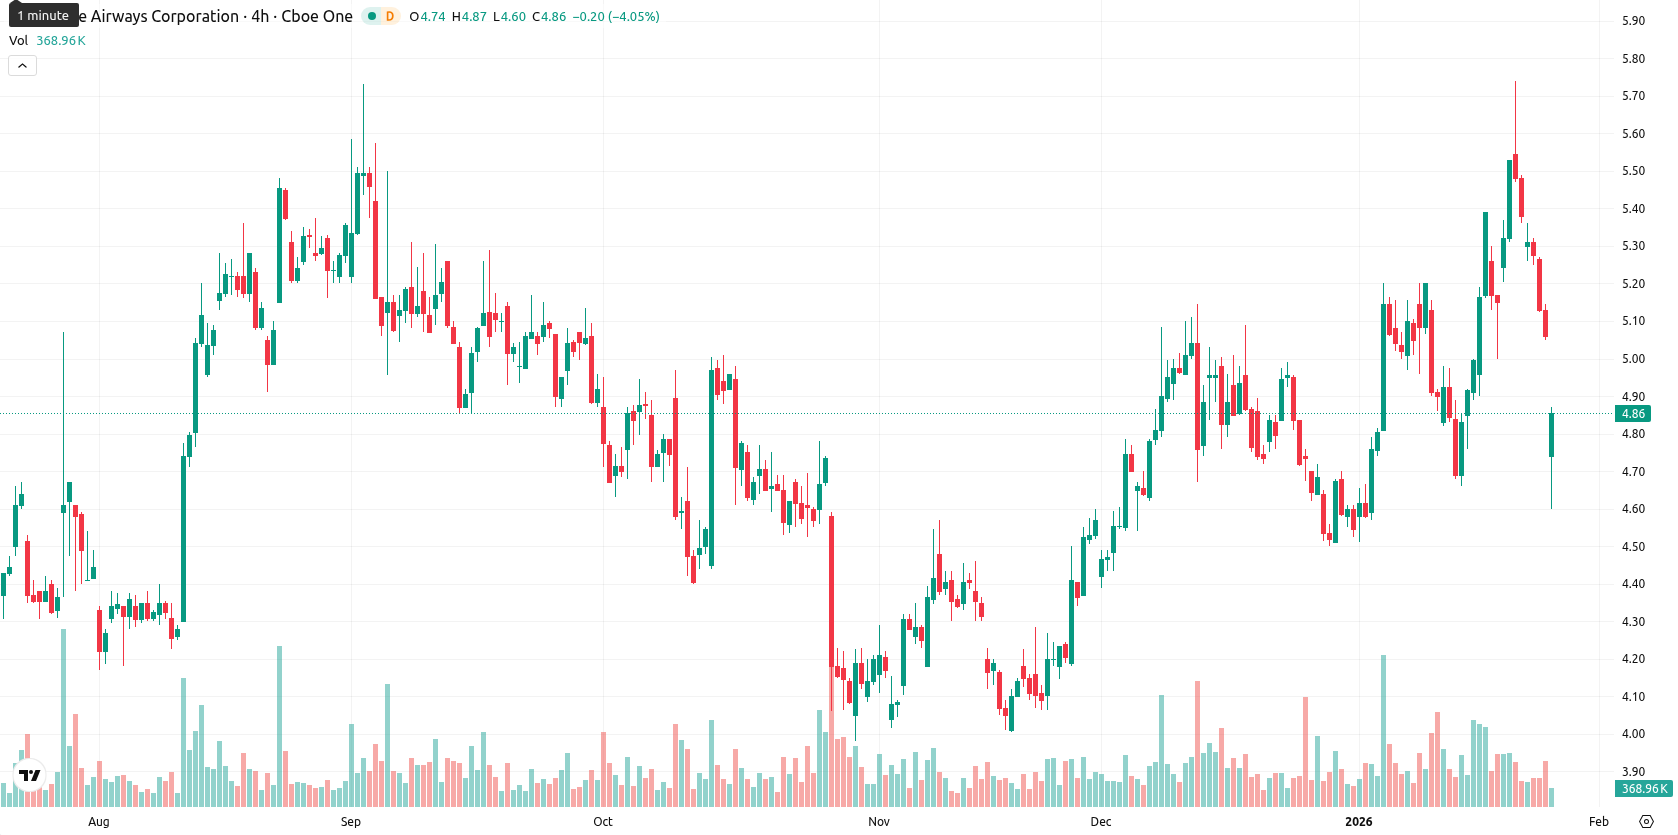
JetBlue Airways Corp (JBLU) is trading at $4.82, slightly below the MA-20 ($4.97) but above the MA-50 ($4.74) and MA-200 ($4.66), highlighting a mixed technical trend.
Highlights
- JetBlue Airways is trading at $4.82, slightly below its MA-20 ($4.97) but above its MA-50 ($4.74) and MA-200 ($4.66), indicating a mixed trend.
- Oscillator signals show divided momentum: MACD indicates a buy while ADX, RSI, and Commodity Channel Index remain in neutral to weak buy zones.
- Expect JetBlue to trade sideways between $4.79 and $4.96 over the next five days; resistance sits at $4.96–$5.13, support at $4.74–$4.79.
Earnings miss and capex cuts reshape margin outlook
JetBlue Airways reported a net loss of $177 million and earnings per share of -$0.49 for the fourth quarter of 2025, missing analyst expectations. Quarterly revenue came in at $2.244 billion, which was $25.5 million below projections. The company noted that its JetForward initiative delivered $305 million in EBIT for 2025 and contributed to a planned $3 billion reduction in capital expenditures for 2026–2029. JetBlue also updated its outlook, guiding to breakeven or better operating margins in 2026.
Upward bias tempered by weak trend and dynamic support
Technical analysis indicates dynamic support near the MA-50 at $4.74, while resistance is marked by the Ichimoku Kijun at $5.13. The MACD shows a buy bias, but the ADX remains neutral, reflecting a weak underlying trend. RSI and CCI suggest neutral to buy conditions, and the Stochastic RSI highlights oversold market characteristics. Bull/Bear Power favors buyers on the daily chart, though intraday data shows some seller strength, as evidenced by the initial gap down from $5.08 to $4.72 and a modest bounce from the $4.67–$4.74 support range.
Sideways price action likely as volatility bands hold
Over the next five trading days, JetBlue Airways is expected to fluctuate within a typical volatility band between $4.79 and $4.96. Momentum and support levels suggest the probability of a price increase is moderate at approximately 50%, with a substantial decline less likely unless support below $4.79 fails. The most probable scenario is sideways movement in this corridor, but a move above $4.96 could enable a test of resistance near $5.13, while a loss of support could push the price toward $4.74.
JetBlue Airways Corporation is currently exhibiting short-term bearish momentum, trading below its 20-day moving average and slightly above the 50- and 200-day averages, with support evident at the longer-term moving average. Technical indicators are mixed—while the daily MACD signals a buy and some oscillators show buyer interest, overall intraday sentiment remains negative amid elevated volatility and resistance at higher levels.


Latest JetBlue News


-
 Afghanistan
-
 Albania
-
 Algeria
-
 Angola
-
 Argentina
-
 Armenia
-
 Australia
-
 Austria
-
 Azerbaijan
-
 Bahamas
-
 Bahrain
-
 Bangladesh
-
 Belarus
-
 Belgium
-
 Bolivia
-
 Botswana
-
 Brazil
-
 Brunei
-
 Bulgaria
-
 Cambodia
-
 Cameroon
-
 Canada
-
 Chile
Chile
-
 China
China
-
 Colombia
-
 Congo
Congo
-
 Costa Rica
-
 Cote d'Ivoire
-
 Croatia
-
 Cuba
Cuba
-
 Cyprus
-
 Czechia
-
 DR Congo
-
 Denmark
-
 Dominican Republic
-
 Ecuador
-
 Egypt
Egypt
-
 El Salvador
-
 Estonia
-
 Eswatini
-
 Ethiopia
-
 Finland
-
 France
-
 Georgia
-
 Germany
-
 Ghana
Ghana
-
 Greece
-
 Haiti
Haiti
-
 Hong Kong
-
 Hungary
-
 India
India
-
 Indonesia
-
 Iran, Islamic republic
-
 Iraq
Iraq
-
 Ireland
-
 Israel
-
 Italy
Italy
-
 Jamaica
-
 Japan
Japan
-
 Jordan
-
 Kazakhstan
-
 Kenya
Kenya
-
 Korea
Korea
-
 Kuwait
-
 Kyrgyzstan
-
 Laos
Laos
-
 Latvia
-
 Lebanon
-
 Lesotho
-
 Libya
Libya
-
 Lithuania
-
 Luxembourg
-
 Madagascar
-
 Malaysia
-
 Malta
Malta
-
 Mauritius
-
 Mexico
-
 Moldova
-
 Mongolia
-
 Montenegro
-
 Morocco
-
 Mozambique
-
 Myanmar
-
 Namibia
-
 Nepal
Nepal
-
 Netherlands
-
 New Zealand
-
 Nigeria
-
 North Macedonia
-
 Norway
-
 Oman
Oman
-
 Pakistan
-
 Palestine
-
 Panama
-
 Papua New Guinea
-
 Paraguay
-
 Peru
Peru
-
 Philippines
-
 Poland
-
 Portugal
-
 Puerto Rico
-
 Qatar
Qatar
-
 Reunion
-
 Romania
-
 Rwanda
-
 Saudi Arabia
-
 Serbia
-
 Singapore
-
 Slovakia
-
 Slovenia
-
 Somalia
-
 South Africa
-
 Spain
Spain
-
 Sri Lanka
-
 Sweden
-
 Switzerland
-
 Syria
Syria
-
 Taiwan
-
 Tajikistan
-
 Tanzania
-
 Thailand
-
 Trinidad and Tobago
-
 Tunisia
-
 Turkey
-
 UAE
UAE
-
 Uganda
-
 Ukraine
-
 United Kingdom
-
United States
-
 Uruguay
-
 Uzbekistan
-
 Venezuela
-
 Vietnam
-
 Yemen
Yemen
-
 Zambia
-
 Zimbabwe
- Forex
- Crypto
