
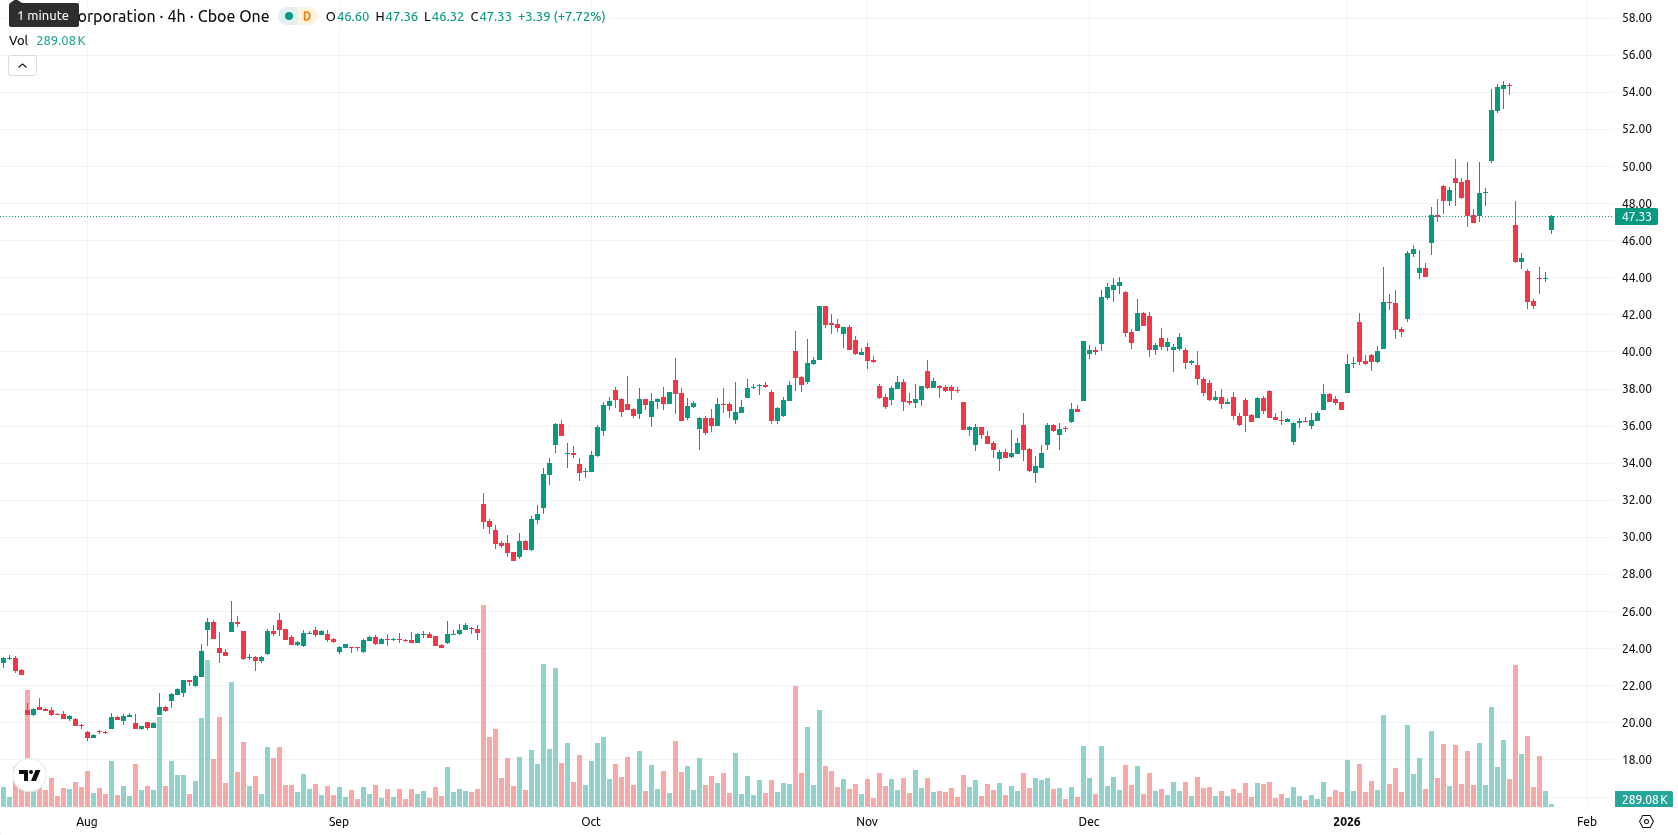
+9.98% for Intel stock — bullish momentum confirmed by technicals and earnings upside

Intel Corporation (INTC) is trading at $48.31, climbing 9.98% today after a sizeable gap up from $43.93 to $47.37. The price is well above the MA-20 ($44.15), MA-50 ($40.26), and MA-200 ($29.39), confirming bullish momentum across all major timeframes.
Highlights
- Intel (INTC) surged 9.98% to $48.31, trading well above MA-20 ($44.15), MA-50 ($40.26), and MA-200 ($29.39), confirming bullish trends across all timeframes.
- Momentum indicators such as MACD and ADX signal a strong and established buy trend, with RSI in bullish territory and only minor signals of short-term exhaustion.
- Key support levels are at the Ichimoku Kijun ($44.78) and MA-50 ($40.26), with resistance near $50.00; the weekly range is projected at $46.00–$50.00 with an 80%+ probability of upside.
Revenue beat and insider buys bolster sentiment as debt weighs
Intel reported its fourth quarter 2025 results with revenue of $13.7 billion, surpassing analyst expectations, and non-GAAP EPS of $0.15, both exceeding estimates. The company also generated $2.22 billion in positive adjusted free cash flow, partly supported by nearly $2 billion from partners and government sources, while facing a growing share count and debt above $46.5 billion. Insider share purchases provided a temporary boost amid a generally cautious sentiment over near-term outlook and sequential declines in data center revenue.
Strong uptrend persists as mixed oscillators flag buyer exhaustion
The nearest dynamic support is the Ichimoku Kijun at $44.78, with the MA-50 at $40.26 serving as a major secondary support, while resistance sits at the $50 round level. Momentum indicators remain positive: the daily MACD signals a strong buy and the ADX reflects an ongoing trend. RSI is in buy territory but below overbought conditions, whereas the Stochastic RSI and Bull/Bear Power point to oversold conditions, indicating some buyer exhaustion or profit-taking even as the overall trend remains strongly upward. The Awesome Oscillator is neutral, offering no confirmation of the prevailing uptrend. Today's session was marked by high intraday volatility and pronounced early strength, though mixed oscillator signals suggest possible short-term divergence.
Consolidation likely as breakout and downside risks diverge
In the next 5 trading days, INTC is expected to trade within a $46.00 to $50.00 volatility band relative to current levels, with more than an 80% probability of continued upward movement. The baseline scenario anticipates consolidation between $46.00 and $50.00. A bullish breakout above $50.00 could enable additional gains, while a move below $46.00 would expose the $44.80 support zone; however, downside risk remains low due to prevailing trend strength.
Previously it was reported that Intel is trading above its key moving averages, confirming a bullish medium- and long-term structure, while short-term signals remain mixed as the price encounters resistance near $44.78 and support at the MA-20. Despite strong momentum indicators like the MACD and ADX, neutral RSI and oversold oscillators suggest continued volatility, with a high probability of consolidation or a breakout as bullish factors outweigh short-term risks.


-
 Afghanistan
-
 Albania
-
 Algeria
-
 Angola
-
 Argentina
-
 Armenia
-
 Australia
-
 Austria
-
 Azerbaijan
-
 Bahamas
-
 Bahrain
-
 Bangladesh
-
 Belarus
-
 Belgium
-
 Bolivia
-
 Botswana
-
 Brazil
-
 Brunei
-
 Bulgaria
-
 Cambodia
-
 Cameroon
-
 Canada
-
 Chile
Chile
-
 China
China
-
 Colombia
-
 Congo
Congo
-
 Costa Rica
-
 Cote d'Ivoire
-
 Croatia
-
 Cuba
Cuba
-
 Cyprus
-
 Czechia
-
 DR Congo
-
 Denmark
-
 Dominican Republic
-
 Ecuador
-
 Egypt
Egypt
-
 El Salvador
-
 Estonia
-
 Eswatini
-
 Ethiopia
-
 Finland
-
 France
-
 Georgia
-
 Germany
-
 Ghana
Ghana
-
 Greece
-
 Haiti
Haiti
-
 Hong Kong
-
 Hungary
-
 India
India
-
 Indonesia
-
 Iran, Islamic republic
-
 Iraq
Iraq
-
 Ireland
-
 Israel
-
 Italy
Italy
-
 Jamaica
-
 Japan
Japan
-
 Jordan
-
 Kazakhstan
-
 Kenya
Kenya
-
 Korea
Korea
-
 Kuwait
-
 Kyrgyzstan
-
 Laos
Laos
-
 Latvia
-
 Lebanon
-
 Lesotho
-
 Libya
Libya
-
 Lithuania
-
 Luxembourg
-
 Madagascar
-
 Malaysia
-
 Malta
Malta
-
 Mauritius
-
 Mexico
-
 Moldova
-
 Mongolia
-
 Montenegro
-
 Morocco
-
 Mozambique
-
 Myanmar
-
 Namibia
-
 Nepal
Nepal
-
 Netherlands
-
 New Zealand
-
 Nigeria
-
 North Macedonia
-
 Norway
-
 Oman
Oman
-
 Pakistan
-
 Palestine
-
 Panama
-
 Papua New Guinea
-
 Paraguay
-
 Peru
Peru
-
 Philippines
-
 Poland
-
 Portugal
-
 Puerto Rico
-
 Qatar
Qatar
-
 Reunion
-
 Romania
-
 Rwanda
-
 Saudi Arabia
-
 Serbia
-
 Singapore
-
 Slovakia
-
 Slovenia
-
 Somalia
-
 South Africa
-
 Spain
Spain
-
 Sri Lanka
-
 Sweden
-
 Switzerland
-
 Syria
Syria
-
 Taiwan
-
 Tajikistan
-
 Tanzania
-
 Thailand
-
 Trinidad and Tobago
-
 Tunisia
-
 Turkey
-
 UAE
UAE
-
 Uganda
-
 Ukraine
-
 United Kingdom
-
United States
-
 Uruguay
-
 Uzbekistan
-
 Venezuela
-
 Vietnam
-
 Yemen
Yemen
-
 Zambia
-
 Zimbabwe
- Forex
- Crypto
