
Affirm stock drops 3.01% as bearish momentum persists despite oversold signals

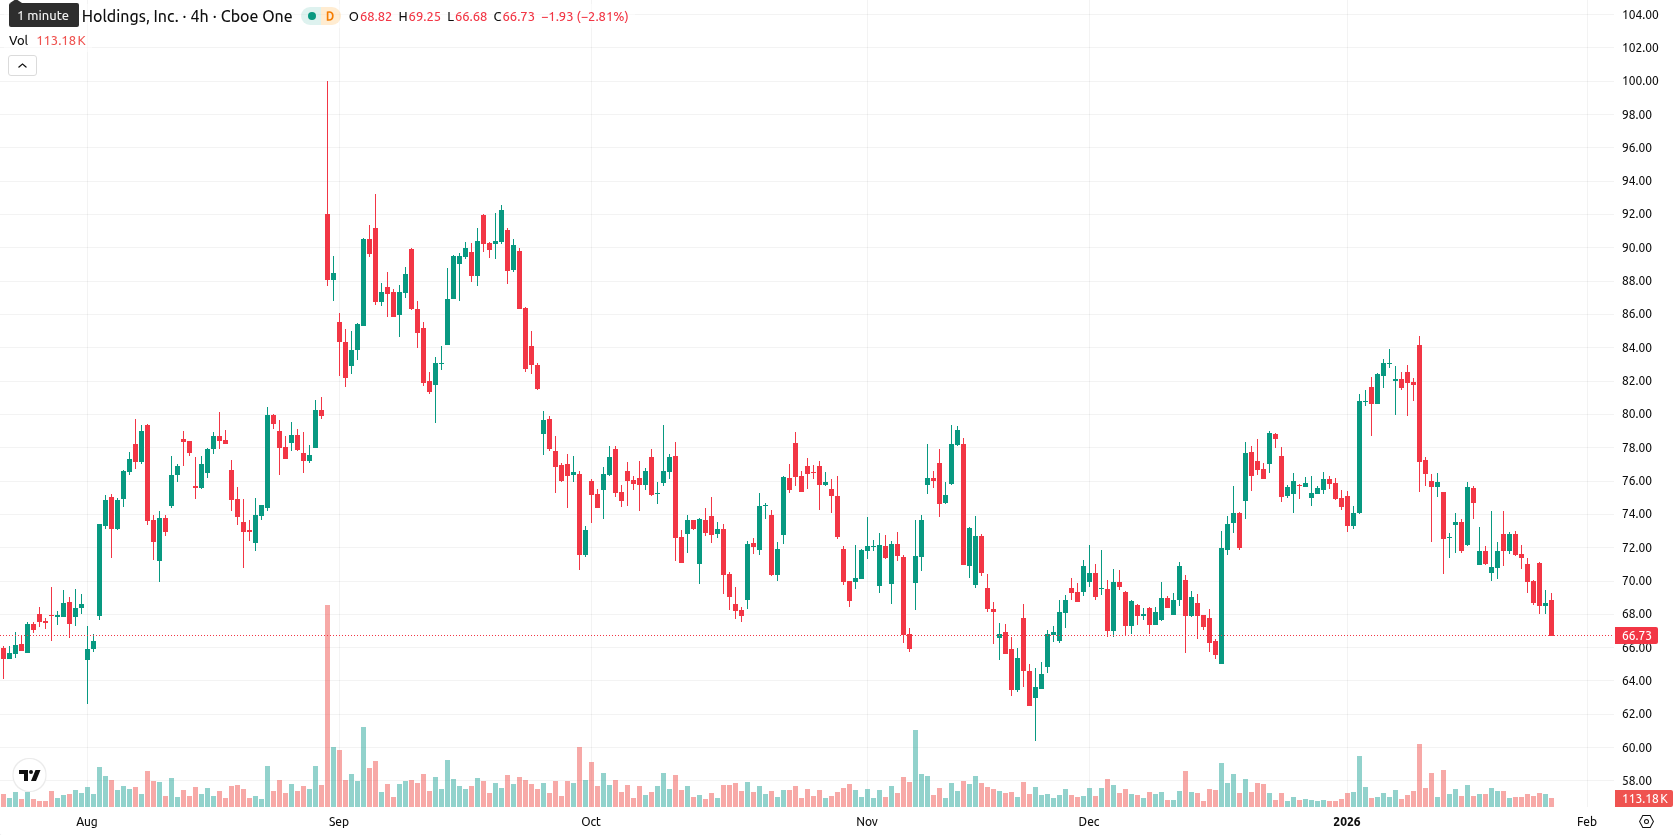
Affirm Holdings, Inc. (AFRM) is trading at $66.72, which is below the MA-20 ($75.28) and MA-50 ($72.13), and slightly beneath the MA-200 ($68.42). This setup points to sustained short- and medium-term selling pressure, with longer-term support appearing near the MA-200 and resistance at the Ichimoku Kijun, currently at $76.34.
Highlights
- AFRM is trading at $66.72, below the MA-20 ($75.28), MA-50 ($72.13), and just beneath MA-200 ($68.42), signaling ongoing short- and medium-term selling pressure.
- Momentum and oscillators, including MACD, ADX, RSI, Stochastic RSI, and CCI, confirm strong bearish sentiment and oversold conditions, with sellers dominating the current session.
- AFRM is expected to remain range-bound between $66.30 and $67.86 over the next five trading days, with less than 20% probability of a meaningful rise.
Deposit funding and partnerships drive expansion amid banking license move
Affirm has applied for a Nevada industrial loan company license to establish Affirm Bank, aiming to gain access to deposit funding for its loans and internalize product risk management. The company also partnered with Bolt to make Affirm the default buy now, pay later provider across Bolt's U.S. one-click checkout network, launching in phases from January 2026. Additionally, Affirm is piloting a rent payment program with Esusu, enabling select renters to split monthly rent into two interest-free installments.
Bearish momentum confirmed as oversold indicators flag exaggerated weakness
Momentum indicators for AFRM signal continued bearish sentiment, as the MACD remains in sell mode and the ADX points to weak trend strength. RSI, Stochastic RSI, and CCI reflect oversold conditions, suggesting price weakness may be exaggerated, while Bull/Bear Power firmly favors sellers. The Awesome Oscillator reinforces this downward pressure. AFRM opened nearly flat versus the previous close, but has dropped 3.01% intraday and is near session lows, highlighting moderate volatility and persistent selling dominance confirmed by both oscillators and momentum indicators.
Limited rebound odds as price faces range-bound scenarios on heavy selling
For the upcoming five trading days, AFRM's price is expected to stay within a typical volatility band from $66.30 to $67.86. Given persistent selling pressure and oversold signals, the probability of a significant rebound is below 20%, suggesting that a further decline or sideways consolidation is more likely. The base scenario has AFRM range-bound between $66.30 and $67.86, with any break above resistance opening a move toward $68.50 – $69.50, while a downside break below $66.30 could lead to declines toward $65.00.
Previously it was reported that Affirm Holdings Inc is trading below its short- and medium-term moving averages, showing persistent seller dominance and weak momentum indicators, while holding just above long-term trend support. Despite oversold technical signals suggesting a possible short-term bounce, current sentiment indicates a higher likelihood of continued sideways or downward movement unless resistance levels near $74.78 are decisively broken.


Latest Affirm News


-
 Afghanistan
-
 Albania
-
 Algeria
-
 Angola
-
 Argentina
-
 Armenia
-
 Australia
-
 Austria
-
 Azerbaijan
-
 Bahamas
-
 Bahrain
-
 Bangladesh
-
 Belarus
-
 Belgium
-
 Bolivia
-
 Botswana
-
 Brazil
-
 Brunei
-
 Bulgaria
-
 Cambodia
-
 Cameroon
-
 Canada
-
 Chile
Chile
-
 China
China
-
 Colombia
-
 Congo
Congo
-
 Costa Rica
-
 Cote d'Ivoire
-
 Croatia
-
 Cuba
Cuba
-
 Cyprus
-
 Czechia
-
 DR Congo
-
 Denmark
-
 Dominican Republic
-
 Ecuador
-
 Egypt
Egypt
-
 El Salvador
-
 Estonia
-
 Eswatini
-
 Ethiopia
-
 Finland
-
 France
-
 Georgia
-
 Germany
-
 Ghana
Ghana
-
 Greece
-
 Haiti
Haiti
-
 Hong Kong
-
 Hungary
-
 India
India
-
 Indonesia
-
 Iran, Islamic republic
-
 Iraq
Iraq
-
 Ireland
-
 Israel
-
 Italy
Italy
-
 Jamaica
-
 Japan
Japan
-
 Jordan
-
 Kazakhstan
-
 Kenya
Kenya
-
 Korea
Korea
-
 Kuwait
-
 Kyrgyzstan
-
 Laos
Laos
-
 Latvia
-
 Lebanon
-
 Lesotho
-
 Libya
Libya
-
 Lithuania
-
 Luxembourg
-
 Madagascar
-
 Malaysia
-
 Malta
Malta
-
 Mauritius
-
 Mexico
-
 Moldova
-
 Mongolia
-
 Montenegro
-
 Morocco
-
 Mozambique
-
 Myanmar
-
 Namibia
-
 Nepal
Nepal
-
 Netherlands
-
 New Zealand
-
 Nigeria
-
 North Macedonia
-
 Norway
-
 Oman
Oman
-
 Pakistan
-
 Palestine
-
 Panama
-
 Papua New Guinea
-
 Paraguay
-
 Peru
Peru
-
 Philippines
-
 Poland
-
 Portugal
-
 Puerto Rico
-
 Qatar
Qatar
-
 Reunion
-
 Romania
-
 Rwanda
-
 Saudi Arabia
-
 Serbia
-
 Singapore
-
 Slovakia
-
 Slovenia
-
 Somalia
-
 South Africa
-
 Spain
Spain
-
 Sri Lanka
-
 Sweden
-
 Switzerland
-
 Syria
Syria
-
 Taiwan
-
 Tajikistan
-
 Tanzania
-
 Thailand
-
 Trinidad and Tobago
-
 Tunisia
-
 Turkey
-
 UAE
UAE
-
 Uganda
-
 Ukraine
-
 United Kingdom
-
United States
-
 Uruguay
-
 Uzbekistan
-
 Venezuela
-
 Vietnam
-
 Yemen
Yemen
-
 Zambia
-
 Zimbabwe
- Forex
- Crypto
