
AST SpaceMobile stock: bullish technicals and strong signals fuel 4.81% rally

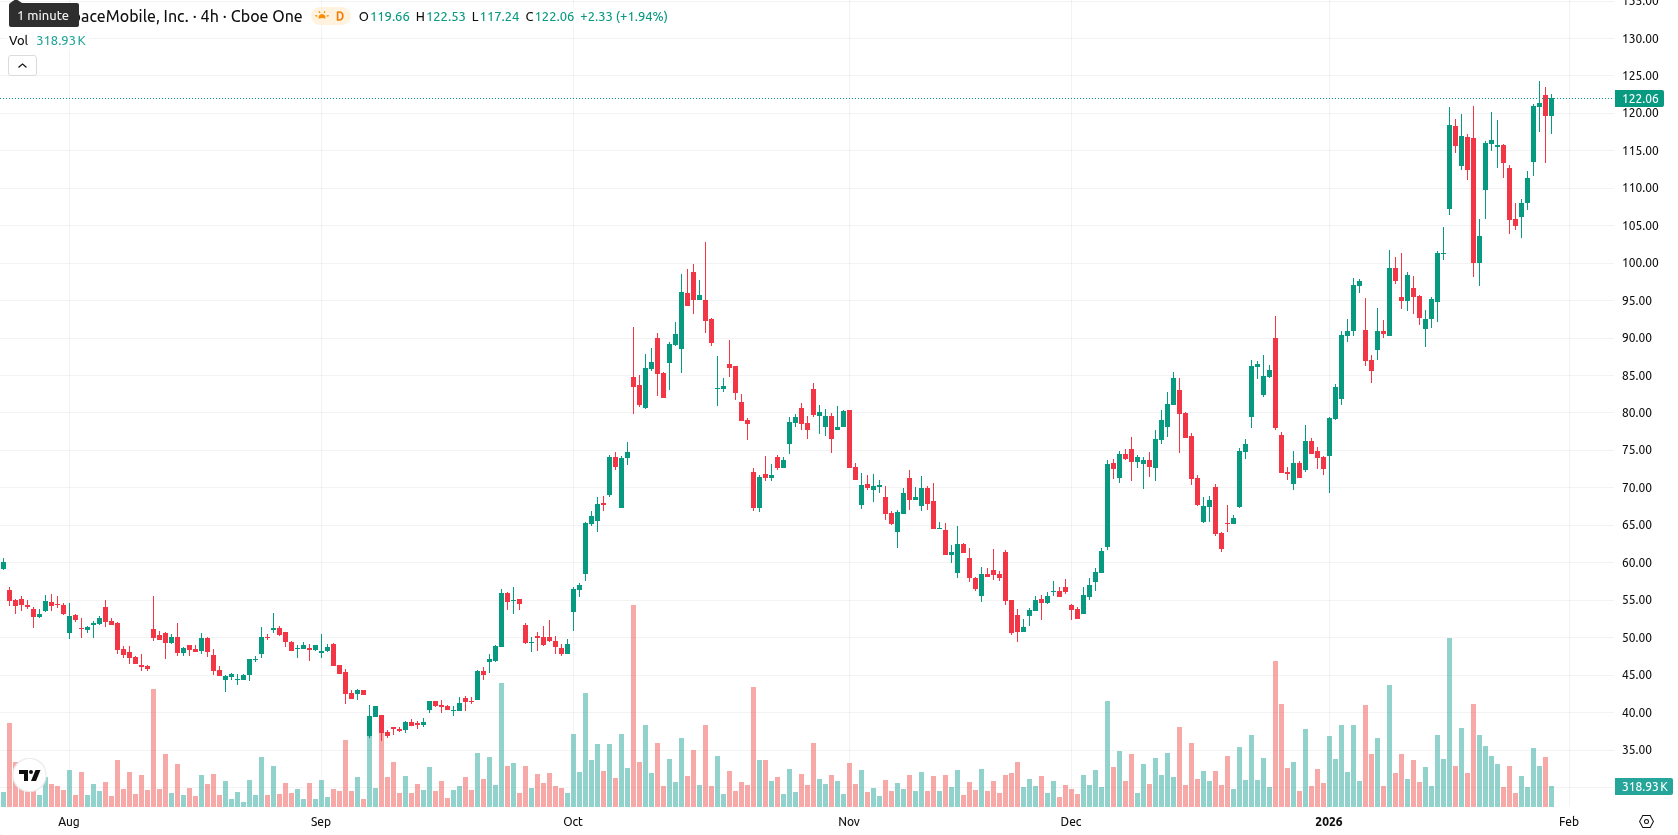
AST SpaceMobile, Inc. (ASTS) is trading at $127.96, which is significantly above its MA-20 at $101.36, MA-50 at $80.75, and MA-200 at $56.02. This alignment confirms a bullish structure across short, medium, and long-term timeframes, with the nearest dynamic support at the Ichimoku Kijun, now at $96.82, while resistance is likely at the next round level above $130.
Highlights
- ASTS is trading at $127.96, well above its MA-20 ($101.36), MA-50 ($80.75), and MA-200 ($56.02), confirming a persistent bullish trend across all timeframes.
- Key momentum indicators like MACD, ADX, and RSI (now at 64.86), all signal strong buyer dominance, though several oscillators warn of overbought conditions.
- For the next five trading days, ASTS is expected to consolidate within a $115–$135 range, with immediate support at $115 and resistance above $135.
Momentum strength persists amid overbought signals and volatile session
Momentum remains strong, as both MACD and ADX continue to signal "Buy" across daily and weekly timeframes. However, multiple oscillators, including CCI and Bull/Bear Power, indicate the market is in overbought territory with pronounced buyer dominance intraday. RSI sits at 64.86, still below classic overbought, but Stochastic RSI and CCI strengthen the warning of stretched conditions, with only the Awesome Oscillator showing neutrality and not contradicting the trend. The price opened near yesterday’s close (no gap), surged to a high intraday, and currently sits near the top end of today’s range, reflecting high volatility and strong follow-through from buyers.
High breakout odds as synchronized indicators favor upside scenario
For the next five trading days, the expected normalized range is $115 to $135, keeping the price within 10% of the current level. There is a very high probability (more than 80%) of a continued upward move and a very low probability of a retracement lower, based on synchronized "Buy" signals across the weekly Moving Average, RSI, ADX, and MACD. The baseline scenario is consolidation in the $115 – $135 corridor. The bullish case envisions a breakout above $135 resistance, potentially extending gains further. The bearish scenario unfolds if prices decline below $115, signaling short-term exhaustion and a potential correction toward the Ichimoku Kijun support.
Previously it was reported that AST SpaceMobile Inc. maintains a robust bullish trend, trading well above major moving averages with momentum indicators such as MACD and ADX confirming ongoing buying strength. Despite high volatility and a recent intraday pullback, the stock exhibits strong support just below current levels and faces resistance in the $120–$125 range, while short-term oscillators signal overbought conditions.


Latest AST SpaceMobile News


-
 Afghanistan
-
 Albania
-
 Algeria
-
 Angola
-
 Argentina
-
 Armenia
-
 Australia
-
 Austria
-
 Azerbaijan
-
 Bahamas
-
 Bahrain
-
 Bangladesh
-
 Belarus
-
 Belgium
-
 Bolivia
-
 Botswana
-
 Brazil
-
 Brunei
-
 Bulgaria
-
 Cambodia
-
 Cameroon
-
 Canada
-
 Chile
Chile
-
 China
China
-
 Colombia
-
 Congo
Congo
-
 Costa Rica
-
 Cote d'Ivoire
-
 Croatia
-
 Cuba
Cuba
-
 Cyprus
-
 Czechia
-
 DR Congo
-
 Denmark
-
 Dominican Republic
-
 Ecuador
-
 Egypt
Egypt
-
 El Salvador
-
 Estonia
-
 Eswatini
-
 Ethiopia
-
 Finland
-
 France
-
 Georgia
-
 Germany
-
 Ghana
Ghana
-
 Greece
-
 Haiti
Haiti
-
 Hong Kong
-
 Hungary
-
 India
India
-
 Indonesia
-
 Iran, Islamic republic
-
 Iraq
Iraq
-
 Ireland
-
 Israel
-
 Italy
Italy
-
 Jamaica
-
 Japan
Japan
-
 Jordan
-
 Kazakhstan
-
 Kenya
Kenya
-
 Korea
Korea
-
 Kuwait
-
 Kyrgyzstan
-
 Laos
Laos
-
 Latvia
-
 Lebanon
-
 Lesotho
-
 Libya
Libya
-
 Lithuania
-
 Luxembourg
-
 Madagascar
-
 Malaysia
-
 Malta
Malta
-
 Mauritius
-
 Mexico
-
 Moldova
-
 Mongolia
-
 Montenegro
-
 Morocco
-
 Mozambique
-
 Myanmar
-
 Namibia
-
 Nepal
Nepal
-
 Netherlands
-
 New Zealand
-
 Nigeria
-
 North Macedonia
-
 Norway
-
 Oman
Oman
-
 Pakistan
-
 Palestine
-
 Panama
-
 Papua New Guinea
-
 Paraguay
-
 Peru
Peru
-
 Philippines
-
 Poland
-
 Portugal
-
 Puerto Rico
-
 Qatar
Qatar
-
 Reunion
-
 Romania
-
 Rwanda
-
 Saudi Arabia
-
 Serbia
-
 Singapore
-
 Slovakia
-
 Slovenia
-
 Somalia
-
 South Africa
-
 Spain
Spain
-
 Sri Lanka
-
 Sweden
-
 Switzerland
-
 Syria
Syria
-
 Taiwan
-
 Tajikistan
-
 Tanzania
-
 Thailand
-
 Trinidad and Tobago
-
 Tunisia
-
 Turkey
-
 UAE
UAE
-
 Uganda
-
 Ukraine
-
 United Kingdom
-
United States
-
 Uruguay
-
 Uzbekistan
-
 Venezuela
-
 Vietnam
-
 Yemen
Yemen
-
 Zambia
-
 Zimbabwe
- Forex
- Crypto
