
SoFi stock falls 3.12% as technical indicators signal ongoing seller pressure

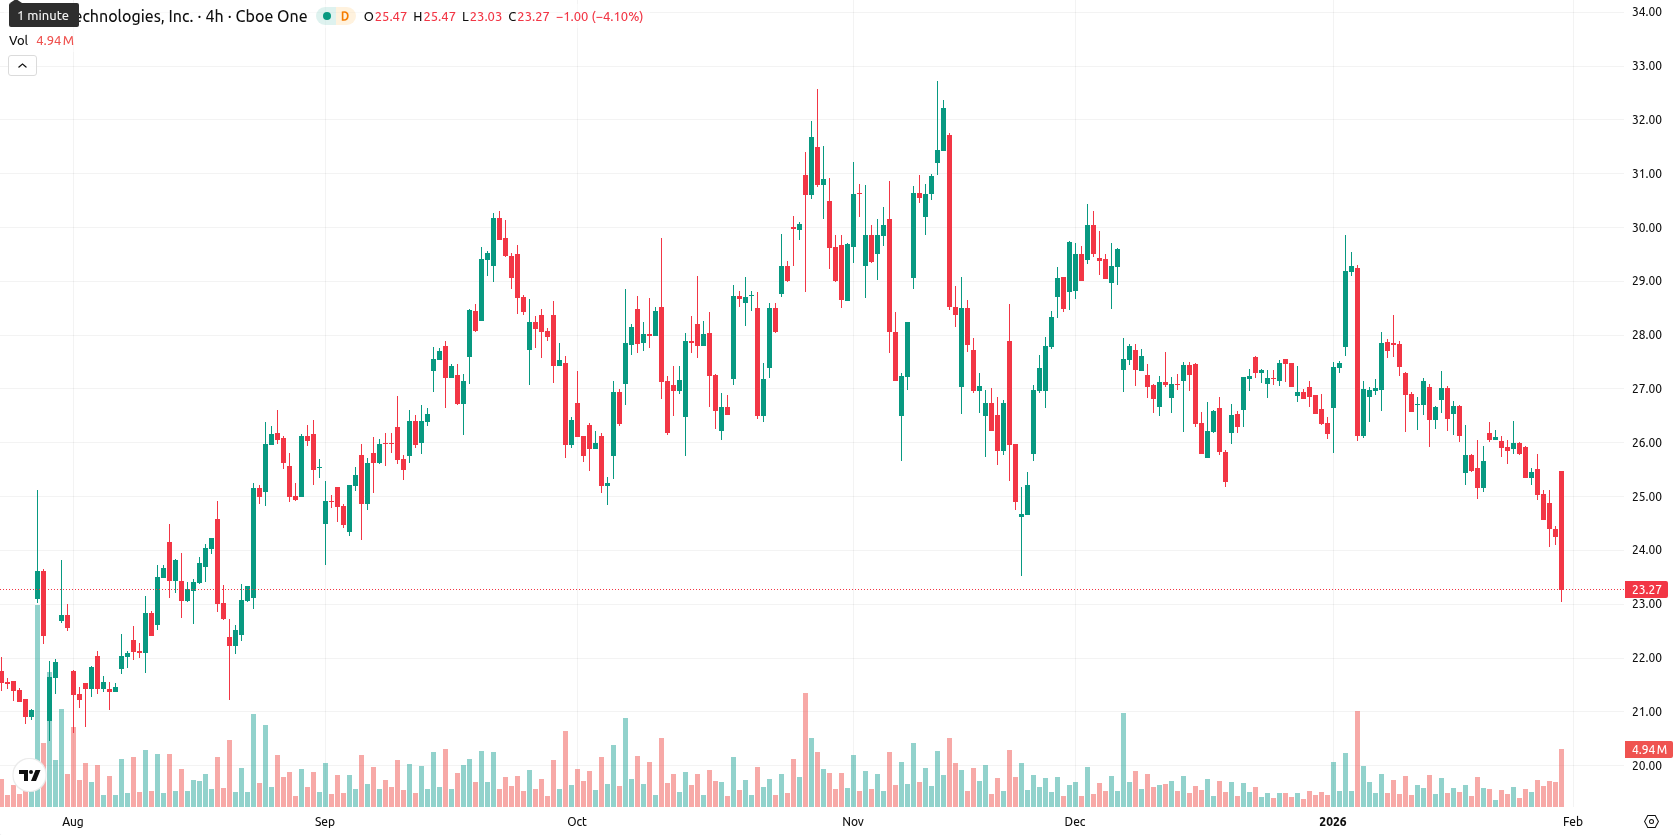
SoFi Technologies, Inc (SOFI) is trading at $23.45, showing a daily decline of $0.75 or 3.12%. The price is below both the MA-20 at $26.41 and MA-50 at $26.93, but still above the MA-200 at $22.63, highlighting short- and medium-term bearish momentum with long-term support nearby.
Highlights
- SoFi Technologies’ Q4 2025 adjusted EPS of $0.13 and $1.01 billion revenue surpassed analyst expectations, driven by strong loan and fee-based business growth.
- Membership reached 13.7 million alongside record product growth and maintained profitability, with management reaffirming its disciplined capital management approach.
- SOFI trades at $23.45, below the MA-20 and MA-50 but above the MA-200 at $22.63, with weak momentum and further downside likely per technical indicators.
Earnings beat with revenue surge as loan and fee growth accelerate
SoFi Technologies reported its fourth-quarter 2025 results on January 30, 2025, posting adjusted earnings per share of $0.13, which surpassed analyst estimates. The company achieved quarterly revenue of approximately $1.01 billion with strong growth in both loan demand and fee-based businesses. Membership reached 13.7 million, alongside record product growth and continued profitability, with management also reaffirming its disciplined capital approach.
Persistent seller pressure dominates amid weak trend momentum
Momentum remains weak, with the daily MACD firmly bearish and the ADX showing a neutral reading, indicating the absence of a strong trend. SOFI is oversold based on both Stochastic RSI and CCI indicators, while RSI at 35.25 continues to reflect ongoing seller pressure; Bull/Bear Power analysis confirms sellers remain in control. Price is trading near today's low after an initial opening gap higher, pointing to persistent intraday volatility and selling, as further evidenced by momentum indicators. No meaningful divergence is observed.
Continued downside risk expected as narrow trading band persists
Over the next five trading days, SOFI is expected to trade within the $23.20 to $24.10 volatility band relative to current levels. The probability of a price increase is low — less than 20% — indicating continued downside risk. The baseline scenario is for price action to move sideways within this recent range; a break above $24.10 could trigger a move toward Ichimoku resistance at $26.96, while a sustained drop below $23.20 raises the likelihood of testing long-term support at the MA-200 near $22.63.
Last time, analysts noted that SoFi Technologies is trading just above its short-term moving average but below medium-term resistance, with long-term technical support remaining intact despite recent downside momentum and heightened volatility. Momentum indicators skew bearish, with low probability of near-term gains, suggesting a likely sideways trend between support at $25.00 and resistance at $28.00 ahead of the upcoming earnings report.


Latest SoFi News


-
 Afghanistan
-
 Albania
-
 Algeria
-
 Angola
-
 Argentina
-
 Armenia
-
 Australia
-
 Austria
-
 Azerbaijan
-
 Bahamas
-
 Bahrain
-
 Bangladesh
-
 Belarus
-
 Belgium
-
 Bolivia
-
 Botswana
-
 Brazil
-
 Brunei
-
 Bulgaria
-
 Cambodia
-
 Cameroon
-
 Canada
-
 Chile
Chile
-
 China
China
-
 Colombia
-
 Congo
Congo
-
 Costa Rica
-
 Cote d'Ivoire
-
 Croatia
-
 Cuba
Cuba
-
 Cyprus
-
 Czechia
-
 DR Congo
-
 Denmark
-
 Dominican Republic
-
 Ecuador
-
 Egypt
Egypt
-
 El Salvador
-
 Estonia
-
 Eswatini
-
 Ethiopia
-
 Finland
-
 France
-
 Georgia
-
 Germany
-
 Ghana
Ghana
-
 Greece
-
 Haiti
Haiti
-
 Hong Kong
-
 Hungary
-
 India
India
-
 Indonesia
-
 Iran, Islamic republic
-
 Iraq
Iraq
-
 Ireland
-
 Israel
-
 Italy
Italy
-
 Jamaica
-
 Japan
Japan
-
 Jordan
-
 Kazakhstan
-
 Kenya
Kenya
-
 Korea
Korea
-
 Kuwait
-
 Kyrgyzstan
-
 Laos
Laos
-
 Latvia
-
 Lebanon
-
 Lesotho
-
 Libya
Libya
-
 Lithuania
-
 Luxembourg
-
 Madagascar
-
 Malaysia
-
 Malta
Malta
-
 Mauritius
-
 Mexico
-
 Moldova
-
 Mongolia
-
 Montenegro
-
 Morocco
-
 Mozambique
-
 Myanmar
-
 Namibia
-
 Nepal
Nepal
-
 Netherlands
-
 New Zealand
-
 Nigeria
-
 North Macedonia
-
 Norway
-
 Oman
Oman
-
 Pakistan
-
 Palestine
-
 Panama
-
 Papua New Guinea
-
 Paraguay
-
 Peru
Peru
-
 Philippines
-
 Poland
-
 Portugal
-
 Puerto Rico
-
 Qatar
Qatar
-
 Reunion
-
 Romania
-
 Rwanda
-
 Saudi Arabia
-
 Serbia
-
 Singapore
-
 Slovakia
-
 Slovenia
-
 Somalia
-
 South Africa
-
 Spain
Spain
-
 Sri Lanka
-
 Sweden
-
 Switzerland
-
 Syria
Syria
-
 Taiwan
-
 Tajikistan
-
 Tanzania
-
 Thailand
-
 Trinidad and Tobago
-
 Tunisia
-
 Turkey
-
 UAE
UAE
-
 Uganda
-
 Ukraine
-
 United Kingdom
-
United States
-
 Uruguay
-
 Uzbekistan
-
 Venezuela
-
 Vietnam
-
 Yemen
Yemen
-
 Zambia
-
 Zimbabwe
- Forex
- Crypto
