
SoFi stock price forecast: high volatility as SOFI slips below key resistance

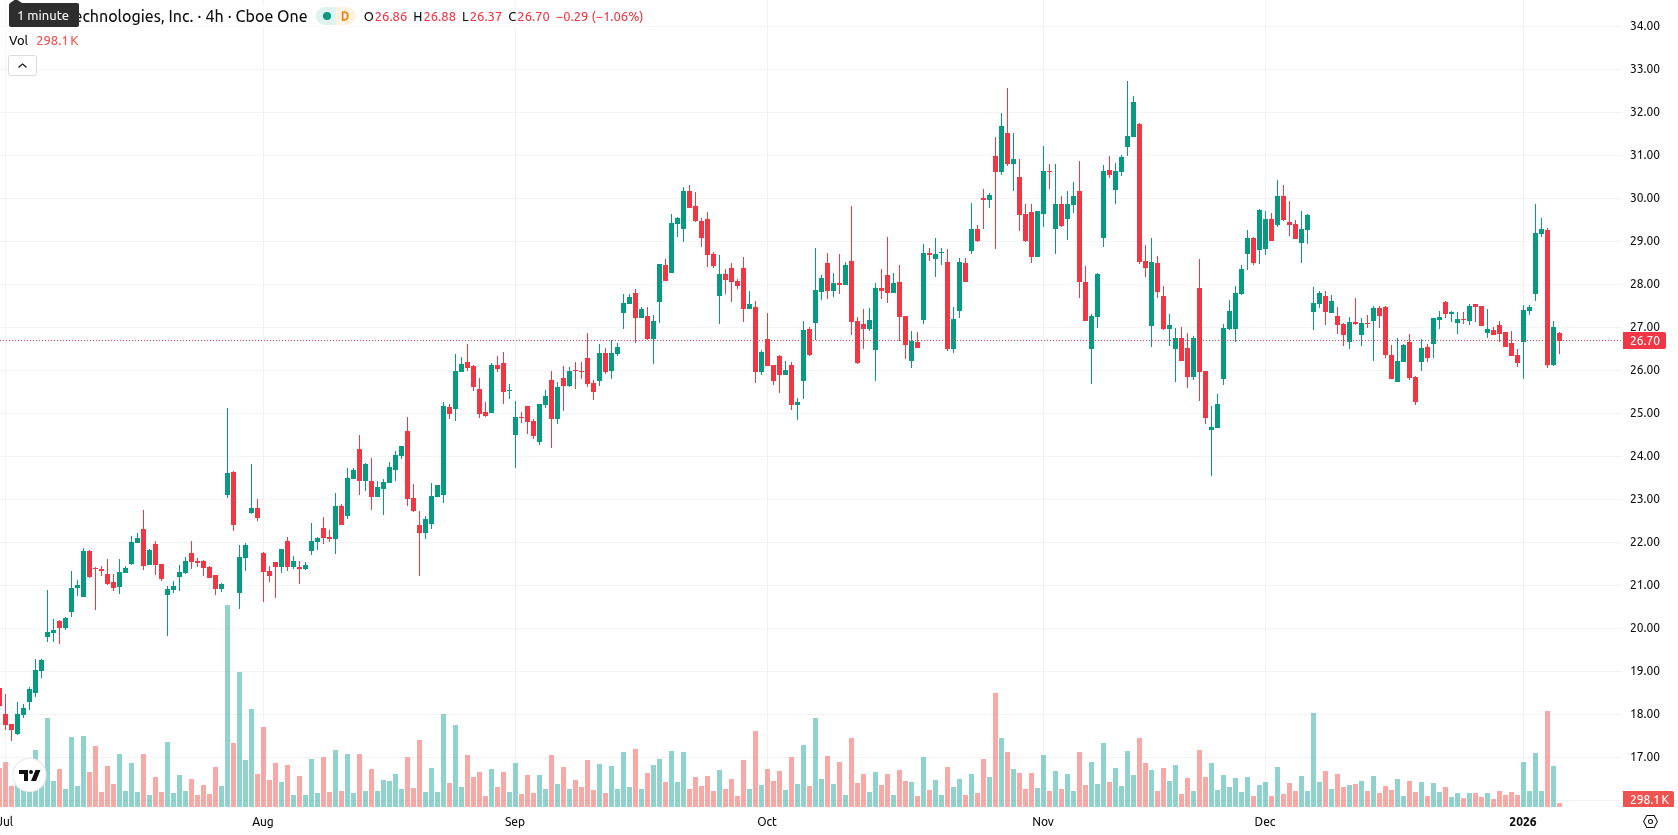
SoFi Technologies, Inc. (SOFI) is trading at $26.99, positioned just above the MA-20 ($26.97) but below the MA-50 ($28.08), suggesting short-term stabilization underneath medium-term resistance. The price remains well above the MA-200 ($21.46), indicating continued long-term support, with the Ichimoku Kijun at $27.80 acting as the nearest dynamic resistance.
Highlights
- SoFi completed a $1.5 billion public equity offering in December 2025, issuing approximately 54.5 million shares at $27.50 per share for growth funding.
- The company continues expanding its member base and fee-based product portfolio, recently launching the SoFi Smart Card as part of new offerings.
- SoFi's next earnings report is scheduled for January 30, 2026, providing investors with the next major update on performance.
Capital raise and product launches drive expansion ahead of earnings report
SoFi completed a $1.5 billion public equity offering in December 2025, issuing about 54.5 million shares at $27.50 per share to raise capital for expansion and new product launches. The company continues to demonstrate growth in its member base and fee-based product offerings, as seen with initiatives like the launch of the SoFi Smart Card. The next earnings report is scheduled for January 30, 2026.
Downside momentum and volatility as buyers diverge from weak signals
Momentum signals are skewed to the downside, as MACD indicates a strong sell and ADX on the D1 is neutral at low levels. RSI and Stochastic RSI point to mild bearishness and no clear oversold conditions, while the Commodity Channel Index presents a shallow positive divergence. Bull/Bear Power signals overbought conditions but shows lingering buyer influence, causing a divergence with momentum weakness. The day opened nearly flat with no gap from the prior close, but fell sharply by 7.82% to trade close to today’s low, reflecting high intraday volatility and heavy selling pressure after the open.
Sideways trend likely as upside chances dim amid downside risks
For the next week, the expected price range is $25.00 to $28.00, adjusted to reflect recent volatility and the current price’s position. The probability of a price increase is very low (less than 20%), making a further decline more likely. The baseline scenario envisions sideways movement between $25.00 and $28.00. A bullish scenario would require a decisive close above $27.80, opening the way to test the $28.00 level, while a bearish outcome could see the price slip toward $25.00 if support breaks.
Previously it was reported that SoFi Technologies is trading well above its key moving averages, maintaining a strong bullish structure with price support at the Kijun and resistance around the $30 level. Despite intraday buyer strength and robust user growth, technical momentum indicators are mixed with overbought signals and a bearish daily MACD, suggesting near-term caution as the stock approaches resistance.


Latest SoFi News


-
 Afghanistan
-
 Albania
-
 Algeria
-
 Angola
-
 Argentina
-
 Armenia
-
 Australia
-
 Austria
-
 Azerbaijan
-
 Bahamas
-
 Bahrain
-
 Bangladesh
-
 Belarus
-
 Belgium
-
 Bolivia
-
 Botswana
-
 Brazil
-
 Brunei
-
 Bulgaria
-
 Cambodia
-
 Cameroon
-
 Canada
-
 Chile
Chile
-
 China
China
-
 Colombia
-
 Congo
Congo
-
 Costa Rica
-
 Cote d'Ivoire
-
 Croatia
-
 Cuba
Cuba
-
 Cyprus
-
 Czechia
-
 DR Congo
-
 Denmark
-
 Dominican Republic
-
 Ecuador
-
 Egypt
Egypt
-
 El Salvador
-
 Estonia
-
 Eswatini
-
 Ethiopia
-
 Finland
-
 France
-
 Georgia
-
 Germany
-
 Ghana
Ghana
-
 Greece
-
 Haiti
Haiti
-
 Hong Kong
-
 Hungary
-
 India
India
-
 Indonesia
-
 Iran, Islamic republic
-
 Iraq
Iraq
-
 Ireland
-
 Israel
-
 Italy
Italy
-
 Jamaica
-
 Japan
Japan
-
 Jordan
-
 Kazakhstan
-
 Kenya
Kenya
-
 Korea
Korea
-
 Kuwait
-
 Kyrgyzstan
-
 Laos
Laos
-
 Latvia
-
 Lebanon
-
 Lesotho
-
 Libya
Libya
-
 Lithuania
-
 Luxembourg
-
 Madagascar
-
 Malaysia
-
 Malta
Malta
-
 Mauritius
-
 Mexico
-
 Moldova
-
 Mongolia
-
 Montenegro
-
 Morocco
-
 Mozambique
-
 Myanmar
-
 Namibia
-
 Nepal
Nepal
-
 Netherlands
-
 New Zealand
-
 Nigeria
-
 North Macedonia
-
 Norway
-
 Oman
Oman
-
 Pakistan
-
 Palestine
-
 Panama
-
 Papua New Guinea
-
 Paraguay
-
 Peru
Peru
-
 Philippines
-
 Poland
-
 Portugal
-
 Puerto Rico
-
 Qatar
Qatar
-
 Reunion
-
 Romania
-
 Rwanda
-
 Saudi Arabia
-
 Serbia
-
 Singapore
-
 Slovakia
-
 Slovenia
-
 Somalia
-
 South Africa
-
 Spain
Spain
-
 Sri Lanka
-
 Sweden
-
 Switzerland
-
 Syria
Syria
-
 Taiwan
-
 Tajikistan
-
 Tanzania
-
 Thailand
-
 Trinidad and Tobago
-
 Tunisia
-
 Turkey
-
 UAE
UAE
-
 Uganda
-
 Ukraine
-
 United Kingdom
-
United States
-
 Uruguay
-
 Uzbekistan
-
 Venezuela
-
 Vietnam
-
 Yemen
Yemen
-
 Zambia
-
 Zimbabwe
- Forex
- Crypto
