
+4.80% for SoFi stock — technical signals point to oversold bounce

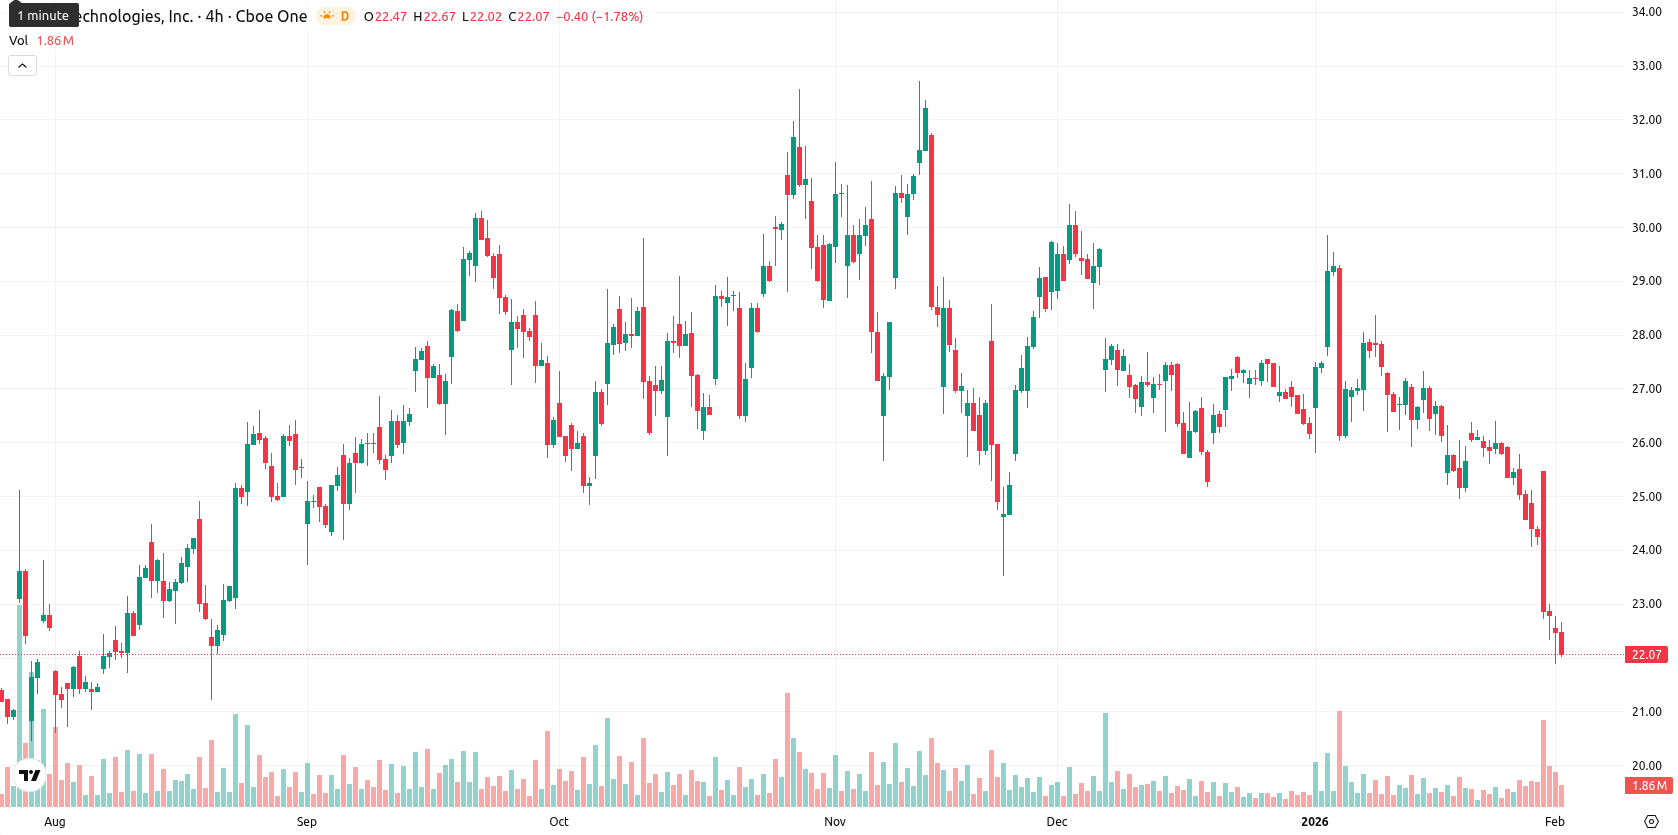
SoFi Technologies, Inc. (SOFI) is trading at $23.14, which is below the MA-20 ($25.97) and MA-50 ($26.77), but just above the MA-200 ($22.74). This reflects ongoing short- and medium-term selling pressure while the long-term trend is currently testing support.
Highlights
- SoFi reported record Q4 2025 results, surpassing $1 billion in adjusted net revenue and achieving $0.13 diluted EPS, driven by strong operational momentum.
- Membership grew by 1 million to 13.7 million, with over half of revenue now from non-lending areas, notably Technology Platform and Financial Services.
- SOFI trades at $23.14, sitting below MA-20 ($25.97) and MA-50 ($26.77) but just above MA-200 support at $22.74, with technicals indicating bearish momentum and oversold conditions.
Strong earnings and diversification as ETF closure adds complexity
SoFi reported record quarterly financial results, with adjusted net revenue exceeding $1 billion for the first time and diluted earnings per share of $0.13 in Q4 2025. The company saw strong member growth by adding 1 million new members in the quarter, bringing the total to 13.7 million, and achieved substantial revenue diversification with over half of revenue now coming from non-lending segments, particularly its Technology Platform and Financial Services. Additionally, SoFi announced the liquidation and closure of its SoFi Next 500 ETF, a move that will be a taxable event for shareholders.
Oversold oscillators and weak trend amid firm support and resistance
Momentum on the daily chart remains weak as shown by the MACD (Sell) and a very low ADX reading (10.18, Neutral), which points to limited trend strength. The nearest dynamic resistance sits at the Ichimoku Kijun level of $25.88, while the MA-200 at $22.74 acts as critical support. Oscillators including RSI (27.01), Stochastic RSI (Oversold), and Commodity Channel Index (Oversold) indicate deeply oversold conditions, and the strongly negative Bull/Bear Power signal confirms that sellers dominate intraday movement. Today’s price action opened with a modest upside gap and is situated near the top of the intraday range ($21.89 — $22.78), suggesting moderate volatility with renewed intraday buying after the open, though a sharp divergence persists between the oversold oscillators and ongoing bearish momentum.
Downside risk persists as short-term recovery remains unlikely
Over the next five sessions, SOFI is likely to trade between $22.30 and $24.50, reflecting typical volatility relative to current levels with a bias toward downside as signaled by MACD, ADX, and moving average alignment. The probability of a price increase in the short term is low (less than 20%), so further decline is more likely unless support holds. Sideways movement is expected while the price remains between MA-200 and the $25.88 resistance. A bullish breakout would require movement above $25.88, while a breakdown below $22.74 could trigger additional losses.
Last time, analysts noted that SoFi Technologies is trading below its short- and medium-term moving averages, with the price hovering just below the long-term MA and technical indicators pointing to oversold territory and persistent bearish momentum. Near-term resistance is positioned above current levels, while weak support and continued downside pressure suggest a further decline is more likely in the coming week.


Latest SoFi News


-
 Afghanistan
-
 Albania
-
 Algeria
-
 Angola
-
 Argentina
-
 Armenia
-
 Australia
-
 Austria
-
 Azerbaijan
-
 Bahamas
-
 Bahrain
-
 Bangladesh
-
 Belarus
-
 Belgium
-
 Bolivia
-
 Botswana
-
 Brazil
-
 Brunei
-
 Bulgaria
-
 Cambodia
-
 Cameroon
-
 Canada
-
 Chile
Chile
-
 China
China
-
 Colombia
-
 Congo
Congo
-
 Costa Rica
-
 Cote d'Ivoire
-
 Croatia
-
 Cuba
Cuba
-
 Cyprus
-
 Czechia
-
 DR Congo
-
 Denmark
-
 Dominican Republic
-
 Ecuador
-
 Egypt
Egypt
-
 El Salvador
-
 Estonia
-
 Eswatini
-
 Ethiopia
-
 Finland
-
 France
-
 Georgia
-
 Germany
-
 Ghana
Ghana
-
 Greece
-
 Haiti
Haiti
-
 Hong Kong
-
 Hungary
-
 India
India
-
 Indonesia
-
 Iran, Islamic republic
-
 Iraq
Iraq
-
 Ireland
-
 Israel
-
 Italy
Italy
-
 Jamaica
-
 Japan
Japan
-
 Jordan
-
 Kazakhstan
-
 Kenya
Kenya
-
 Korea
Korea
-
 Kuwait
-
 Kyrgyzstan
-
 Laos
Laos
-
 Latvia
-
 Lebanon
-
 Lesotho
-
 Libya
Libya
-
 Lithuania
-
 Luxembourg
-
 Madagascar
-
 Malaysia
-
 Malta
Malta
-
 Mauritius
-
 Mexico
-
 Moldova
-
 Mongolia
-
 Montenegro
-
 Morocco
-
 Mozambique
-
 Myanmar
-
 Namibia
-
 Nepal
Nepal
-
 Netherlands
-
 New Zealand
-
 Nigeria
-
 North Macedonia
-
 Norway
-
 Oman
Oman
-
 Pakistan
-
 Palestine
-
 Panama
-
 Papua New Guinea
-
 Paraguay
-
 Peru
Peru
-
 Philippines
-
 Poland
-
 Portugal
-
 Puerto Rico
-
 Qatar
Qatar
-
 Reunion
-
 Romania
-
 Rwanda
-
 Saudi Arabia
-
 Serbia
-
 Singapore
-
 Slovakia
-
 Slovenia
-
 Somalia
-
 South Africa
-
 Spain
Spain
-
 Sri Lanka
-
 Sweden
-
 Switzerland
-
 Syria
Syria
-
 Taiwan
-
 Tajikistan
-
 Tanzania
-
 Thailand
-
 Trinidad and Tobago
-
 Tunisia
-
 Turkey
-
 UAE
UAE
-
 Uganda
-
 Ukraine
-
 United Kingdom
-
United States
-
 Uruguay
-
 Uzbekistan
-
 Venezuela
-
 Vietnam
-
 Yemen
Yemen
-
 Zambia
-
 Zimbabwe
- Forex
- Crypto
