
Riot Platforms stock price forecast: Buy signals emerge as RIOT climbs 4.24% toward $16 resistance

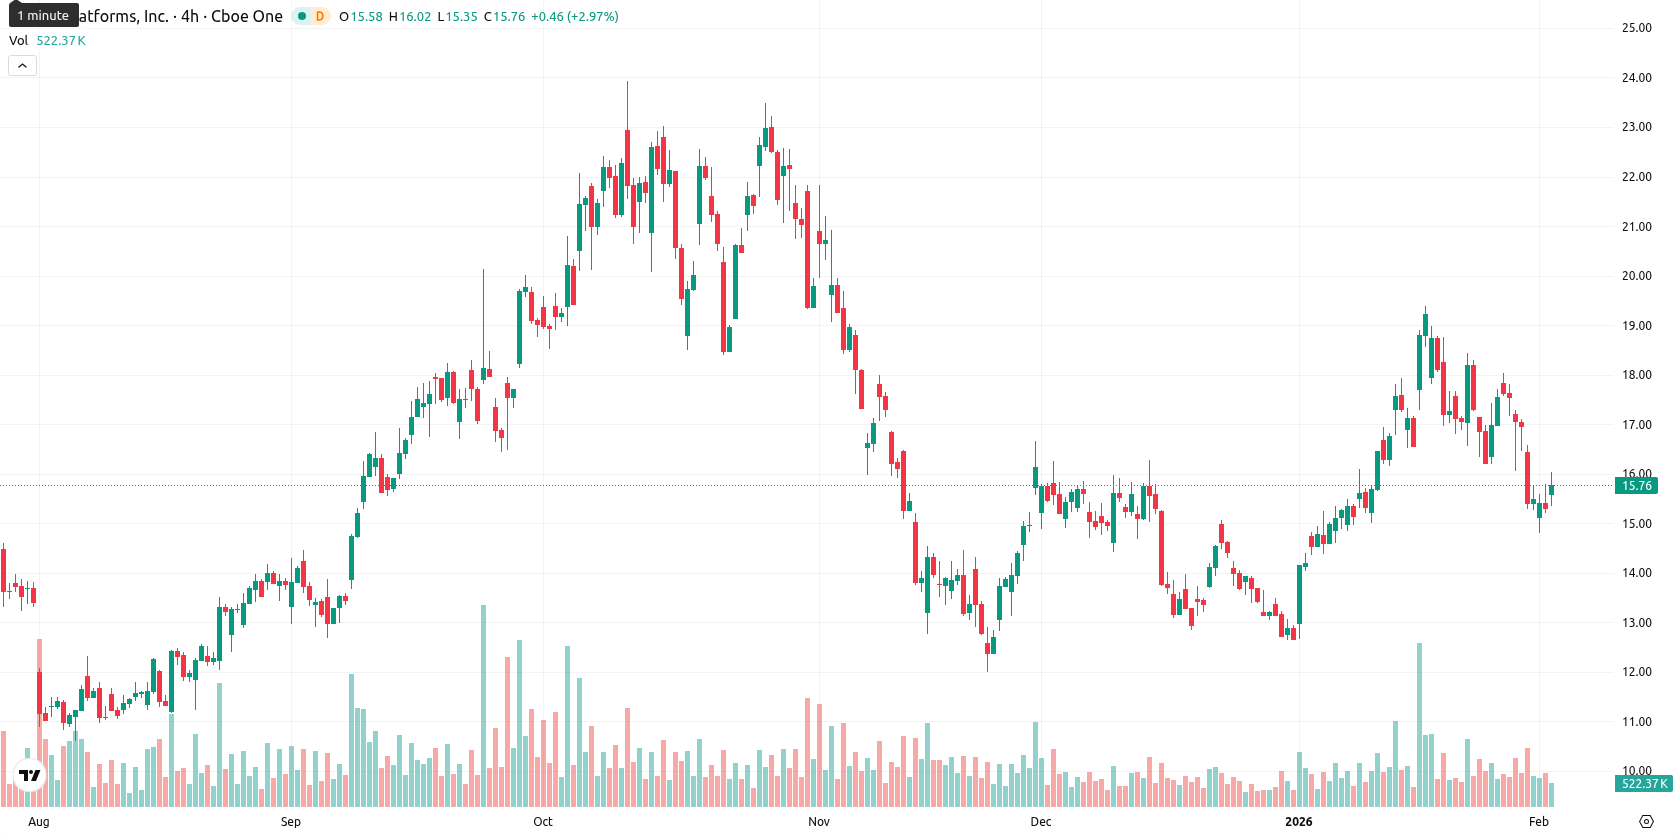
Riot Platforms, Inc. (RIOT) is trading at $15.97, which is below the MA-20 at $16.53 but above the MA-50 at $15.18 and the MA-200 at $13.87, indicating near-term selling pressure while retaining medium- and long-term support.
Highlights
- RIOT closed at $15.97, below the MA-20 ($16.53) but above the MA-50 ($15.18) and MA-200 ($13.87), indicating mixed short- and long-term momentum.
- Major oscillators signal short-term oversold conditions (RSI D1: 45.42, Stoch RSI: oversold, CCI: –82.15), while MACD D1 issues a strong buy signal.
- Expected price consolidation ranges from $15.00–$17.20 for the next five days; probability of a price increase above $16.00 is high (>80%).
Resistance capped at Ichimoku Kijun as indicators signal oversold risk
The nearest dynamic resistance is the Ichimoku Kijun at $15.99, while the closest support sits at the MA-50 of $15.18. Momentum indicators are mixed: MACD D1 shows a strong buy, ADX D1 is neutral and weak at 18.70, and major oscillators (RSI D1 at 45.42, Stochastic RSI in oversold, and CCI at –82.15) highlight short-term oversold conditions. Bull/Bear Power is firmly negative at –0.71, indicating seller dominance despite a neutral Awesome Oscillator. The stock opened with a modest gap up and currently trades near the session high, reflecting daily strength toward the high but a divergence with negative momentum signals.
Upside consolidation scenario as bullish momentum outweighs downside risk
For the next five trading days, the typical volatility band is $15.00 to $17.20, just above current levels. A price increase is likely, given the strong buy signals from most weekly indicators, while a decline is less probable. The baseline scenario points to consolidation between $15.00 and $17.20. A bullish breakout above $16.00 could see upside toward $17.20, while failure to hold support may trigger a retreat toward $15.00.
Most recently, Riot Platforms Inc traded just below its short-term moving average, with the price supported by medium- and long-term averages and dynamic support nearby, suggesting underlying technical resilience despite immediate bearish momentum. Key momentum and oscillator readings—including a bullish MACD, neutral RSI and ADX, and oversold conditions on the Stochastic RSI and other indicators—reflect a mixed intraday outlook with prevailing selling pressure, set against a backdrop of renewed investment and expanding revenue.


-
 Afghanistan
-
 Albania
-
 Algeria
-
 Angola
-
 Argentina
-
 Armenia
-
 Australia
-
 Austria
-
 Azerbaijan
-
 Bahamas
-
 Bahrain
-
 Bangladesh
-
 Belarus
-
 Belgium
-
 Bolivia
-
 Botswana
-
 Brazil
-
 Brunei
-
 Bulgaria
-
 Cambodia
-
 Cameroon
-
 Canada
-
 Chile
Chile
-
 China
China
-
 Colombia
-
 Congo
Congo
-
 Costa Rica
-
 Cote d'Ivoire
-
 Croatia
-
 Cuba
Cuba
-
 Cyprus
-
 Czechia
-
 DR Congo
-
 Denmark
-
 Dominican Republic
-
 Ecuador
-
 Egypt
Egypt
-
 El Salvador
-
 Estonia
-
 Eswatini
-
 Ethiopia
-
 Finland
-
 France
-
 Georgia
-
 Germany
-
 Ghana
Ghana
-
 Greece
-
 Haiti
Haiti
-
 Hong Kong
-
 Hungary
-
 India
India
-
 Indonesia
-
 Iran, Islamic republic
-
 Iraq
Iraq
-
 Ireland
-
 Israel
-
 Italy
Italy
-
 Jamaica
-
 Japan
Japan
-
 Jordan
-
 Kazakhstan
-
 Kenya
Kenya
-
 Korea
Korea
-
 Kuwait
-
 Kyrgyzstan
-
 Laos
Laos
-
 Latvia
-
 Lebanon
-
 Lesotho
-
 Libya
Libya
-
 Lithuania
-
 Luxembourg
-
 Madagascar
-
 Malaysia
-
 Malta
Malta
-
 Mauritius
-
 Mexico
-
 Moldova
-
 Mongolia
-
 Montenegro
-
 Morocco
-
 Mozambique
-
 Myanmar
-
 Namibia
-
 Nepal
Nepal
-
 Netherlands
-
 New Zealand
-
 Nigeria
-
 North Macedonia
-
 Norway
-
 Oman
Oman
-
 Pakistan
-
 Palestine
-
 Panama
-
 Papua New Guinea
-
 Paraguay
-
 Peru
Peru
-
 Philippines
-
 Poland
-
 Portugal
-
 Puerto Rico
-
 Qatar
Qatar
-
 Reunion
-
 Romania
-
 Rwanda
-
 Saudi Arabia
-
 Serbia
-
 Singapore
-
 Slovakia
-
 Slovenia
-
 Somalia
-
 South Africa
-
 Spain
Spain
-
 Sri Lanka
-
 Sweden
-
 Switzerland
-
 Syria
Syria
-
 Taiwan
-
 Tajikistan
-
 Tanzania
-
 Thailand
-
 Trinidad and Tobago
-
 Tunisia
-
 Turkey
-
 UAE
UAE
-
 Uganda
-
 Ukraine
-
 United Kingdom
-
United States
-
 Uruguay
-
 Uzbekistan
-
 Venezuela
-
 Vietnam
-
 Yemen
Yemen
-
 Zambia
-
 Zimbabwe
- Forex
- Crypto
