
Upbeat data center outlook and AI demand fuel optimism — AMD stock falls 3.59%

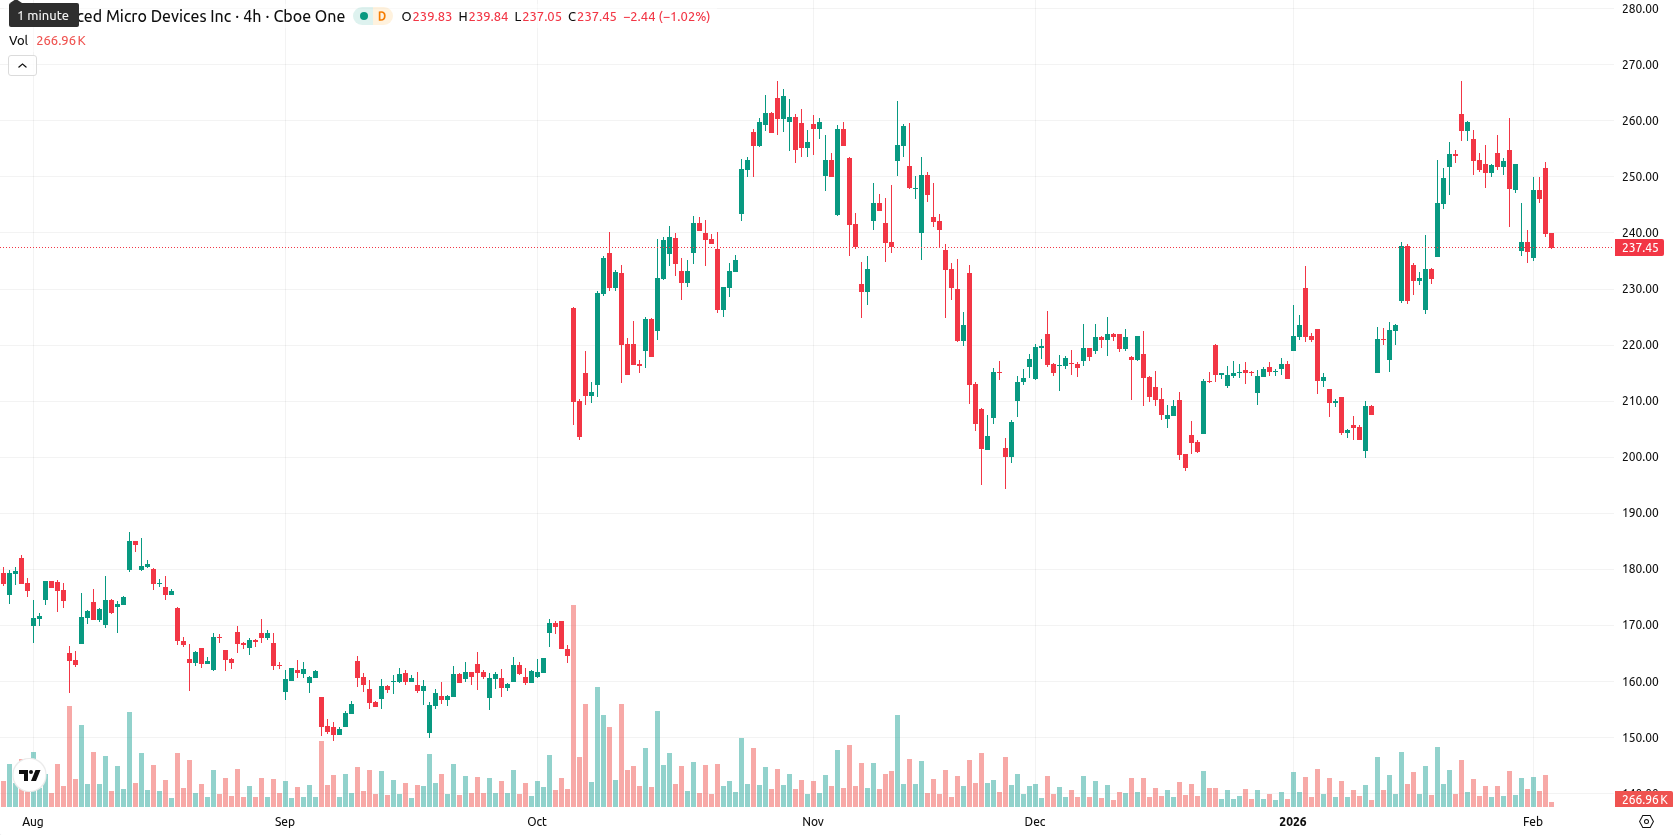
Advanced Micro Devices, Inc. (AMD) is trading at $237.33, positioning it above both the MA-20 ($232.58) and MA-50 ($221.57), and far above the MA-200 ($176.55). This layout indicates buyers continue to support the short- and medium-term uptrend, while the long-term bullish structure remains intact.
Highlights
- AMD reports Q4 and full-year 2025 earnings on February 3, 2026, with projected data center and AI segment revenues growing at double-digit rates year-over-year.
- Q4 revenue guidance stands between $9.6 and $9.67 billion, bolstered by recent strategic partnerships with Oracle and IBM ahead of the earnings release.
- AMD trades at $237.33, above key moving averages (MA-20: $232.58, MA-50: $221.57), with near-term support at $234.10 and resistance at $247.23, reflecting a bullish but volatile setup.
Earnings optimism and AI growth forecasts fuel positive sentiment
AMD is set to report its fourth-quarter and full-year 2025 earnings after the market close on February 3, 2026, with expectations of robust performance in its data center and AI segments. The company has projected double-digit year-over-year revenue growth for these divisions and anticipates Q4 revenue to reach between $9.6 and $9.67 billion. Recent partnerships with cloud providers like Oracle and IBM have also contributed to positive sentiment ahead of the earnings release.
Bullish momentum and overbought signals clash amid intraday volatility
The nearest dynamic support is the Daily Ichimoku Kijun at $233.35. If upward momentum resumes, the MA-50 near $221.57 is now the key support, while $250 acts as resistance. Momentum indicators show divergence. The MACD on the daily chart remains in buy mode, but the ADX is neutral, signaling a lack of directional conviction. The RSI is above 58, suggesting buyers still have an edge, yet the Stochastic RSI sits at neutral and the CCI provides a similar signal. The Bull/Bear Power indicator is classified as overbought on the daily timeframe, hinting at recent buyer dominance, but intraday signals have shifted to oversold, especially on shorter timeframes. The Awesome Oscillator is neutral and does not add confirmation. AMD opened the session with an upward gap (previous close $246.17, today's open $251.62) but has since dropped 3.59% intraday, now trading near the low end of today’s range ($238.89 – $251.67), with high volatility and clear pressure after the open. The interplay between ongoing bullish momentum and intraday selling pressure highlights short-term uncertainty.
Sideways bias expected as bullish weekly signals reduce downside risk
For the next five trading days, AMD is expected to fluctuate between $234.10 and $247.23, containing the current price within a typical volatility band relative to current levels. The probability of an increase remains very high (more than 80%) as all relevant weekly signals (MA-50, RSI, ADX, and MACD) are bullish, making a decline much less likely. The baseline scenario sees AMD trading sideways within this corridor. In a bullish case, a close above $247.23 could trigger renewed upside, while a break below $234.10 would point to a deeper pullback towards the Ichimoku Kijun or the MA-50.
Previously it was reported that AMD is trading well above key moving averages, reflecting a bullish structure across short, medium, and long-term trends, with dynamic support near the Ichimoku Kijun and resistance expected around the next round number. Momentum indicators such as MACD continue to favor the uptrend, though oscillators highlight potential overbought conditions and elevated volatility as the stock approaches resistance.


Latest AMD News


-
 Afghanistan
-
 Albania
-
 Algeria
-
 Angola
-
 Argentina
-
 Armenia
-
 Australia
-
 Austria
-
 Azerbaijan
-
 Bahamas
-
 Bahrain
-
 Bangladesh
-
 Belarus
-
 Belgium
-
 Bolivia
-
 Botswana
-
 Brazil
-
 Brunei
-
 Bulgaria
-
 Cambodia
-
 Cameroon
-
 Canada
-
 Chile
Chile
-
 China
China
-
 Colombia
-
 Congo
Congo
-
 Costa Rica
-
 Cote d'Ivoire
-
 Croatia
-
 Cuba
Cuba
-
 Cyprus
-
 Czechia
-
 DR Congo
-
 Denmark
-
 Dominican Republic
-
 Ecuador
-
 Egypt
Egypt
-
 El Salvador
-
 Estonia
-
 Eswatini
-
 Ethiopia
-
 Finland
-
 France
-
 Georgia
-
 Germany
-
 Ghana
Ghana
-
 Greece
-
 Haiti
Haiti
-
 Hong Kong
-
 Hungary
-
 India
India
-
 Indonesia
-
 Iran, Islamic republic
-
 Iraq
Iraq
-
 Ireland
-
 Israel
-
 Italy
Italy
-
 Jamaica
-
 Japan
Japan
-
 Jordan
-
 Kazakhstan
-
 Kenya
Kenya
-
 Korea
Korea
-
 Kuwait
-
 Kyrgyzstan
-
 Laos
Laos
-
 Latvia
-
 Lebanon
-
 Lesotho
-
 Libya
Libya
-
 Lithuania
-
 Luxembourg
-
 Madagascar
-
 Malaysia
-
 Malta
Malta
-
 Mauritius
-
 Mexico
-
 Moldova
-
 Mongolia
-
 Montenegro
-
 Morocco
-
 Mozambique
-
 Myanmar
-
 Namibia
-
 Nepal
Nepal
-
 Netherlands
-
 New Zealand
-
 Nigeria
-
 North Macedonia
-
 Norway
-
 Oman
Oman
-
 Pakistan
-
 Palestine
-
 Panama
-
 Papua New Guinea
-
 Paraguay
-
 Peru
Peru
-
 Philippines
-
 Poland
-
 Portugal
-
 Puerto Rico
-
 Qatar
Qatar
-
 Reunion
-
 Romania
-
 Rwanda
-
 Saudi Arabia
-
 Serbia
-
 Singapore
-
 Slovakia
-
 Slovenia
-
 Somalia
-
 South Africa
-
 Spain
Spain
-
 Sri Lanka
-
 Sweden
-
 Switzerland
-
 Syria
Syria
-
 Taiwan
-
 Tajikistan
-
 Tanzania
-
 Thailand
-
 Trinidad and Tobago
-
 Tunisia
-
 Turkey
-
 UAE
UAE
-
 Uganda
-
 Ukraine
-
 United Kingdom
-
United States
-
 Uruguay
-
 Uzbekistan
-
 Venezuela
-
 Vietnam
-
 Yemen
Yemen
-
 Zambia
-
 Zimbabwe
- Forex
- Crypto
