
Riot Platforms stock: Technical weakness and oversold signals drive a 9.58% decline

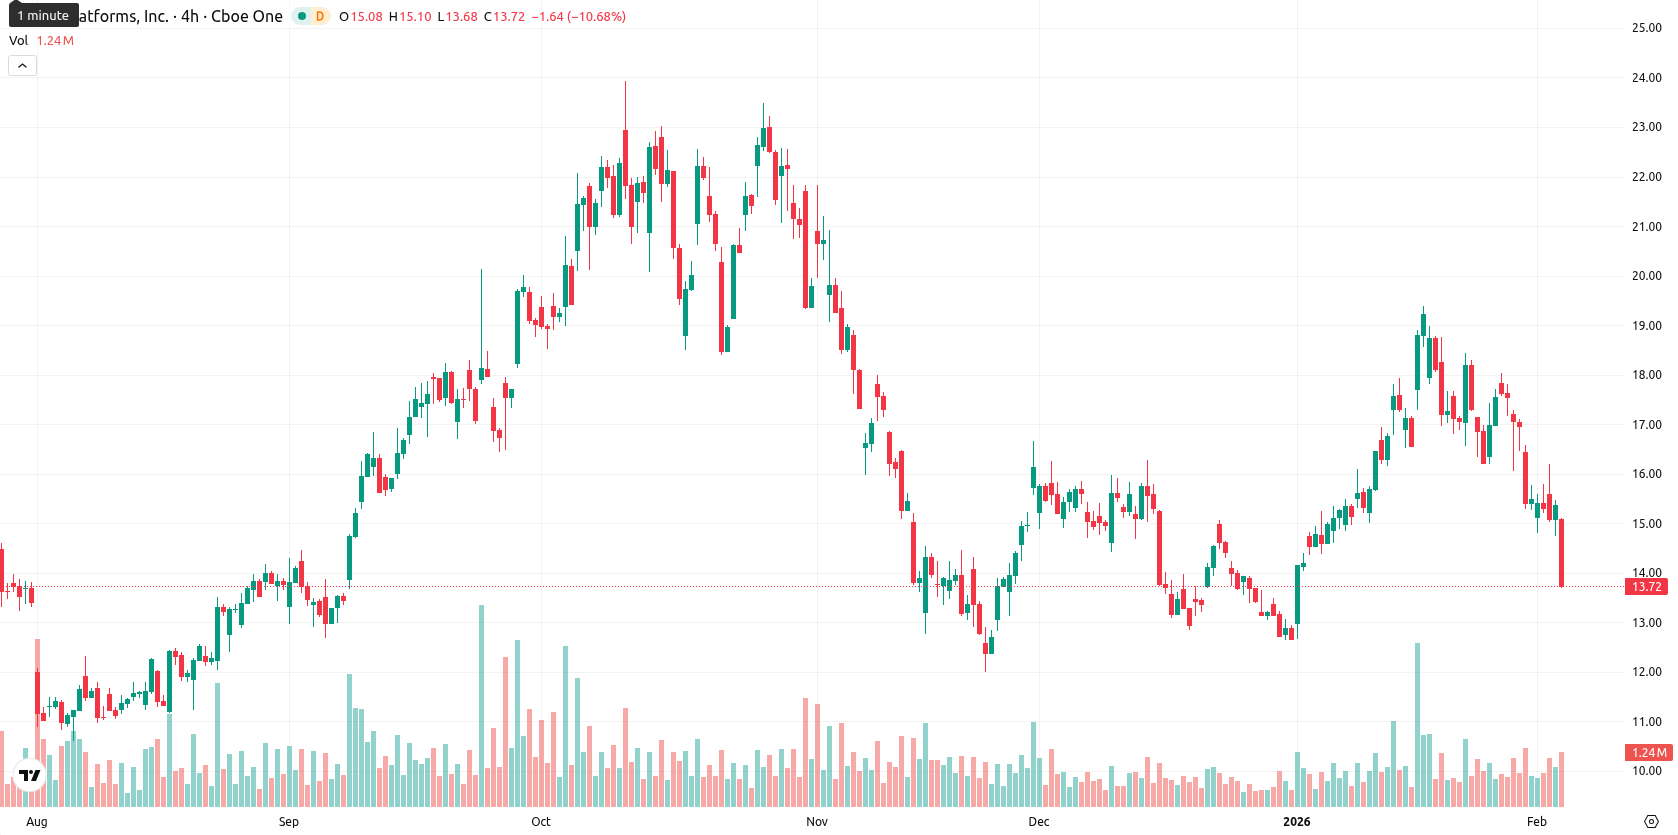
Riot Platforms, Inc. (RIOT, formerly Riot Blockchain) is trading at $13.87, below the MA-20 ($16.56) and MA-50 ($15.22), and just under the MA-200 ($13.92). This positioning indicates that both the short- and medium-term trends for RIOT remain generally weak, while the MA-200 is acting as a key long-term support level.
Highlights
- RIOT closed at $13.87, trading below both the MA-20 ($16.56) and MA-50 ($15.22), but just below long-term support near the MA-200 ($13.92).
- Sellers remained dominant with a sharp intraday drop of 9.58%, oversold signals across multiple oscillators, and persistent high volatility throughout the session.
- Probabilistic models suggest an 80% chance of price increase next week, with price expected to consolidate between $13.90 support and $15.99 resistance, barring a bearish breakdown below $13.80.
Mixed momentum and strong selling as volatility spikes
Momentum signals for RIOT are mixed. The daily MACD issues a Strong Buy signal, but the ADX at 18.19 is Neutral, reflecting weak trend strength. Oversold readings dominate on the Stochastic RSI, CCI, and Bull/Bear Power (–0.13), highlighting persistent seller dominance within the session. Increased volatility is evident, with sellers driving the price rapidly toward the lower boundary of the $13.72 – $15.06 range and intraday signals highlighting pronounced uncertainty.
Volatility band widens amid high upside and breakout risks
Over the coming week, the expected volatility band ranges from $13.10 to $15.40, reflecting recent levels and overall market movement. Upside potential remains high (80%) due to bullish signals on the weekly Moving Averages, RSI, ADX, and MACD. The base scenario is for consolidation between dynamic support at $13.90 and resistance at $15.99. A breakout above $15.99 could open the path toward the mid-$15 area, while sustained selling below $13.80 would likely drive a move toward $13.10.
Previously it was reported that Riot Platforms Inc. is experiencing short- and medium-term selling pressure as it trades below its 20- and 50-day moving averages, although support remains above the 200-day average despite heightened intraday volatility. Momentum indicators are mixed, with the RSI leaning bearish and several oscillators indicating oversold conditions, while dynamic resistance from the Ichimoku indicator limits upside potential.


-
 Afghanistan
-
 Albania
-
 Algeria
-
 Angola
-
 Argentina
-
 Armenia
-
 Australia
-
 Austria
-
 Azerbaijan
-
 Bahamas
-
 Bahrain
-
 Bangladesh
-
 Belarus
-
 Belgium
-
 Bolivia
-
 Botswana
-
 Brazil
-
 Brunei
-
 Bulgaria
-
 Cambodia
-
 Cameroon
-
 Canada
-
 Chile
Chile
-
 China
China
-
 Colombia
-
 Congo
Congo
-
 Costa Rica
-
 Cote d'Ivoire
-
 Croatia
-
 Cuba
Cuba
-
 Cyprus
-
 Czechia
-
 DR Congo
-
 Denmark
-
 Dominican Republic
-
 Ecuador
-
 Egypt
Egypt
-
 El Salvador
-
 Estonia
-
 Eswatini
-
 Ethiopia
-
 Finland
-
 France
-
 Georgia
-
 Germany
-
 Ghana
Ghana
-
 Greece
-
 Haiti
Haiti
-
 Hong Kong
-
 Hungary
-
 India
India
-
 Indonesia
-
 Iran, Islamic republic
-
 Iraq
Iraq
-
 Ireland
-
 Israel
-
 Italy
Italy
-
 Jamaica
-
 Japan
Japan
-
 Jordan
-
 Kazakhstan
-
 Kenya
Kenya
-
 Korea
Korea
-
 Kuwait
-
 Kyrgyzstan
-
 Laos
Laos
-
 Latvia
-
 Lebanon
-
 Lesotho
-
 Libya
Libya
-
 Lithuania
-
 Luxembourg
-
 Madagascar
-
 Malaysia
-
 Malta
Malta
-
 Mauritius
-
 Mexico
-
 Moldova
-
 Mongolia
-
 Montenegro
-
 Morocco
-
 Mozambique
-
 Myanmar
-
 Namibia
-
 Nepal
Nepal
-
 Netherlands
-
 New Zealand
-
 Nigeria
-
 North Macedonia
-
 Norway
-
 Oman
Oman
-
 Pakistan
-
 Palestine
-
 Panama
-
 Papua New Guinea
-
 Paraguay
-
 Peru
Peru
-
 Philippines
-
 Poland
-
 Portugal
-
 Puerto Rico
-
 Qatar
Qatar
-
 Reunion
-
 Romania
-
 Rwanda
-
 Saudi Arabia
-
 Serbia
-
 Singapore
-
 Slovakia
-
 Slovenia
-
 Somalia
-
 South Africa
-
 Spain
Spain
-
 Sri Lanka
-
 Sweden
-
 Switzerland
-
 Syria
Syria
-
 Taiwan
-
 Tajikistan
-
 Tanzania
-
 Thailand
-
 Trinidad and Tobago
-
 Tunisia
-
 Turkey
-
 UAE
UAE
-
 Uganda
-
 Ukraine
-
 United Kingdom
-
United States
-
 Uruguay
-
 Uzbekistan
-
 Venezuela
-
 Vietnam
-
 Yemen
Yemen
-
 Zambia
-
 Zimbabwe
- Forex
- Crypto
