
CleanSpark stock price forecast: Technical barriers persist as CLSK slides under $10.10

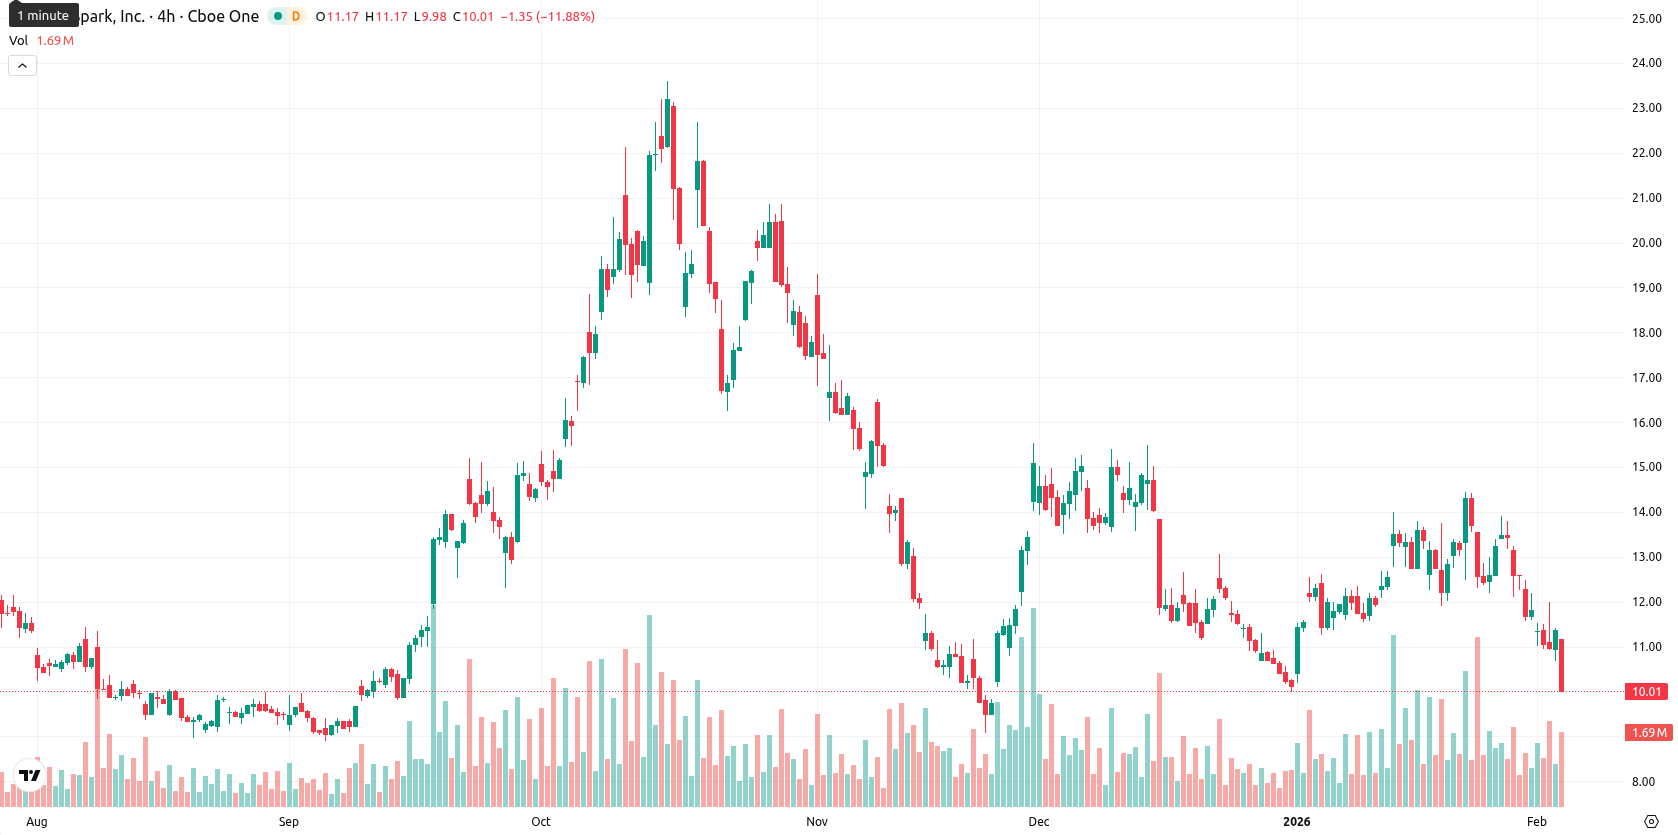
CleanSpark, Inc. (CLSK) is trading at $10.02, down sharply by 11.84% from the previous close. The asset is positioned well below the MA-20 ($12.50), MA-50 ($12.48), and MA-200 ($12.09), indicating sustained selling pressure and confirming a bearish structure relative to short, medium, and long-term trends.
Highlights
- CleanSpark will report Q1 2026 results after market close on February 5, 2026, coinciding with its acquisition of up to 447 acres in Brazoria County, Texas and a long-term power extension to support high-performance computing expansion.
- In January 2026, CleanSpark produced 573 BTC, raising total Bitcoin holdings to 13,513 BTC and expanding its operational fleet to 50 EH/s, with institutional ownership reaching 43.12%.
- CLSK closed at $10.02, sitting below key averages and support, with all major technical indicators signaling strong bearish momentum and an expected price range of $9.00–$11.20.
Expansion in Texas and BTC output as earnings report nears
CleanSpark is set to report its Q1 2026 earnings results after the market closes on February 5, 2026, following the company's announcement of a definitive agreement to acquire up to 447 acres in Brazoria County, Texas and secure a long-term power extension supporting new high-performance computing infrastructure. In January 2026, CleanSpark produced 573 BTC, raising its total Bitcoin holdings to 13,513 BTC and expanding its operational fleet to 50 EH/s. Recent expansions in Texas, alongside a growing institutional ownership of 43.12%, illustrate the company's ongoing scale-up in both energy infrastructure and Bitcoin operations.
Multi-level resistance and oversold momentum reinforce bearish setup
Technically, CLSK faces strong resistance at the Ichimoku Kijun ($12.21), with all major moving averages overhead, reinforcing stiff downward pressure. Short-term support appears limited to psychological levels near today’s lows, as the price remains decisively beneath the MA-20, MA-50, and MA-200. Momentum remains negative across the board: daily MACD and ADX signal weak, directionless movement; RSI, CCI, and Stochastic RSI all point to deeply oversold conditions. Bull/Bear Power confirms seller strength, while the Awesome Oscillator presents a neutral stance.
Sideways drift or further losses as rebound odds stay low
The current volatility band for CLSK is set between $9.00 and $11.20, reflecting recent price swings and persistent downside momentum. Given overwhelmingly bearish signals from daily and weekly indicators, the chance of a rebound remains below 20%, favoring either sideways consolidation beneath $11.20 or further losses on a break of $10.00 support. A bullish move would require a decisive close above $12.21 to shift momentum in buyers' favor.
Last time, analysts noted that CleanSpark Inc. (CLSK) is trading well below its key moving averages, with persistent bearish sentiment reflected by weak momentum indicators and deepening oversold conditions across the daily chart. The price closed near the session low following a steep intraday decline, with sellers maintaining control amid low trend strength and no clear reversal signal.


Latest CleanSpark News


-
 Afghanistan
-
 Albania
-
 Algeria
-
 Angola
-
 Argentina
-
 Armenia
-
 Australia
-
 Austria
-
 Azerbaijan
-
 Bahamas
-
 Bahrain
-
 Bangladesh
-
 Belarus
-
 Belgium
-
 Bolivia
-
 Botswana
-
 Brazil
-
 Brunei
-
 Bulgaria
-
 Cambodia
-
 Cameroon
-
 Canada
-
 Chile
Chile
-
 China
China
-
 Colombia
-
 Congo
Congo
-
 Costa Rica
-
 Cote d'Ivoire
-
 Croatia
-
 Cuba
Cuba
-
 Cyprus
-
 Czechia
-
 DR Congo
-
 Denmark
-
 Dominican Republic
-
 Ecuador
-
 Egypt
Egypt
-
 El Salvador
-
 Estonia
-
 Eswatini
-
 Ethiopia
-
 Finland
-
 France
-
 Georgia
-
 Germany
-
 Ghana
Ghana
-
 Greece
-
 Haiti
Haiti
-
 Hong Kong
-
 Hungary
-
 India
India
-
 Indonesia
-
 Iran, Islamic republic
-
 Iraq
Iraq
-
 Ireland
-
 Israel
-
 Italy
Italy
-
 Jamaica
-
 Japan
Japan
-
 Jordan
-
 Kazakhstan
-
 Kenya
Kenya
-
 Korea
Korea
-
 Kuwait
-
 Kyrgyzstan
-
 Laos
Laos
-
 Latvia
-
 Lebanon
-
 Lesotho
-
 Libya
Libya
-
 Lithuania
-
 Luxembourg
-
 Madagascar
-
 Malaysia
-
 Malta
Malta
-
 Mauritius
-
 Mexico
-
 Moldova
-
 Mongolia
-
 Montenegro
-
 Morocco
-
 Mozambique
-
 Myanmar
-
 Namibia
-
 Nepal
Nepal
-
 Netherlands
-
 New Zealand
-
 Nigeria
-
 North Macedonia
-
 Norway
-
 Oman
Oman
-
 Pakistan
-
 Palestine
-
 Panama
-
 Papua New Guinea
-
 Paraguay
-
 Peru
Peru
-
 Philippines
-
 Poland
-
 Portugal
-
 Puerto Rico
-
 Qatar
Qatar
-
 Reunion
-
 Romania
-
 Rwanda
-
 Saudi Arabia
-
 Serbia
-
 Singapore
-
 Slovakia
-
 Slovenia
-
 Somalia
-
 South Africa
-
 Spain
Spain
-
 Sri Lanka
-
 Sweden
-
 Switzerland
-
 Syria
Syria
-
 Taiwan
-
 Tajikistan
-
 Tanzania
-
 Thailand
-
 Trinidad and Tobago
-
 Tunisia
-
 Turkey
-
 UAE
UAE
-
 Uganda
-
 Ukraine
-
 United Kingdom
-
United States
-
 Uruguay
-
 Uzbekistan
-
 Venezuela
-
 Vietnam
-
 Yemen
Yemen
-
 Zambia
-
 Zimbabwe
- Forex
- Crypto
