
Weak guidance and capital spending plans worry investors — Amazon stock drops 9.23%

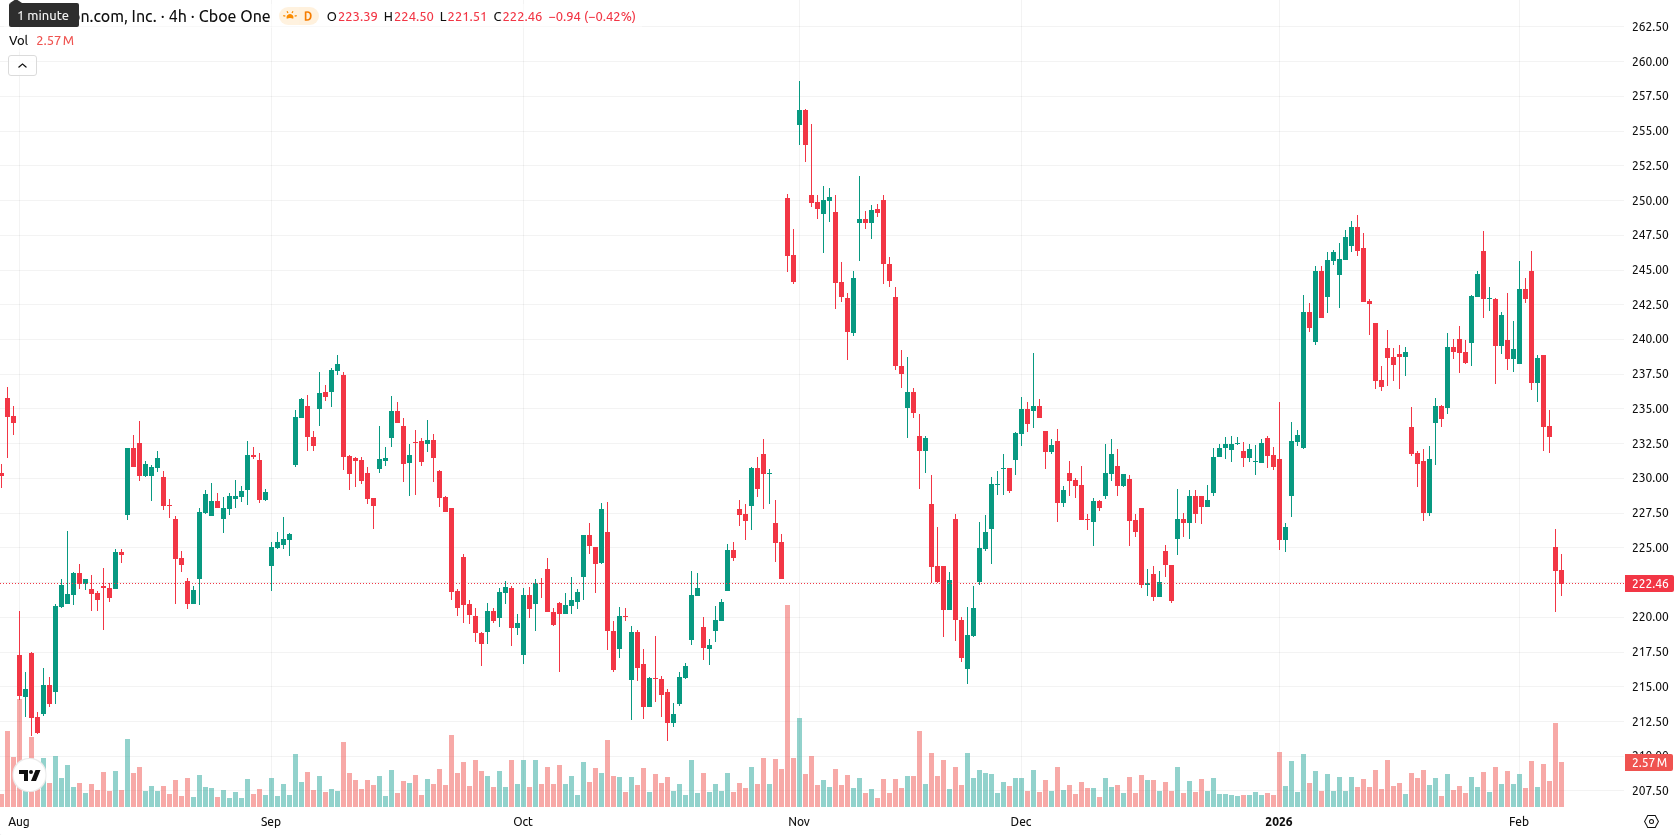
Amazon.com, Inc. (AMZN) is trading at $202.13, down $20.56 or 9.23% today and firmly beneath the MA-20 at $238.85, MA-50 at $233.62, and MA-200 at $223.00. This underperformance places AMZN below all key moving averages, indicating strong selling pressure across short-, medium-, and long-term trends, with the closest dynamic resistance at the Ichimoku Kijun level of $234.67.
Highlights
- Amazon posted record Q4 revenue of $213.4 billion (up 14% YoY) and net income of $21.2 billion, with AWS sales up 24% to $35.6 billion.
- Capital expenditures are projected to rise toward $200 billion by 2026 for AI infrastructure and hardware, reducing free cash flow to $11.2 billion and excluding an annual dividend.
- AMZN trades at $202.13, significantly below key moving averages (MA-20 at $238.85), with technical signals indicating strong bearish momentum and elevated downside risk below $200.
Record earnings overshadowed by capex surge and weak forecasts
Amazon reported fourth-quarter earnings with record revenue of $213.4 billion, up 14% year over year, and net income of $21.2 billion. The company outlined a plan to increase capital expenditures to about $200 billion for 2026, targeting AI infrastructure, data centers, and hardware such as chips and satellites, resulting in a decline in free cash flow to $11.2 billion from $38.2 billion. AWS sales rose 24% to $35.6 billion, and Amazon announced it will not pay an annual dividend in 2026. Additionally, the company gave operating income guidance for the first quarter below analyst expectations and is selling its 49% stake in NextStar Energy to LG Energy Solution.
Oversold signals with bearish momentum confirming seller control
Technical signals for AMZN are decisively bearish. Momentum remains weak, with both MACD and ADX reflecting neutral to bearish trends, while nearly all oscillators signal oversold conditions: RSI at 35.92, Stochastic RSI at 0.00, CCI at -243.12, and Bull/Bear Power at -10.06. The Awesome Oscillator is neutral, and the stock is currently trading near the lower end of the daily range ($200.51–$204.64), confirming high volatility. There are no notable bullish divergences, and the collective alignment underscores strong seller dominance.
High probability of further downside amid consolidation risks
Over the next five trading days, the expected price band for AMZN is $195–$210, reflecting typical volatility after the sharp decline. The likelihood of further downside is high, exceeding 80%, with sellers remaining in control. Baseline expectations point to sideways consolidation near these levels as oversold conditions may prompt limited stabilization. For a reversal to take hold, AMZN would need to reclaim $210–$215 on renewed momentum, while a sustained drop below $200 could drive a move to new weekly lows if heavy selling persists.
Last time, analysts noted that Amazon.com, Inc. is trading just above its long-term moving average but remains under short- and medium-term pressure, with mixed momentum signals and oscillators highlighting oversold conditions and seller dominance amid heightened volatility. The MA-200 near $223 serves as key support, while resistance is defined by the Ichimoku Kijun and higher moving averages, with probability favoring a near-term sideways or modestly higher move barring a breakdown of support.


Latest Amazon News


-
 Afghanistan
-
 Albania
-
 Algeria
-
 Angola
-
 Argentina
-
 Armenia
-
 Australia
-
 Austria
-
 Azerbaijan
-
 Bahamas
-
 Bahrain
-
 Bangladesh
-
 Belarus
-
 Belgium
-
 Bolivia
-
 Botswana
-
 Brazil
-
 Brunei
-
 Bulgaria
-
 Cambodia
-
 Cameroon
-
 Canada
-
 Chile
Chile
-
 China
China
-
 Colombia
-
 Congo
Congo
-
 Costa Rica
-
 Cote d'Ivoire
-
 Croatia
-
 Cuba
Cuba
-
 Cyprus
-
 Czechia
-
 DR Congo
-
 Denmark
-
 Dominican Republic
-
 Ecuador
-
 Egypt
Egypt
-
 El Salvador
-
 Estonia
-
 Eswatini
-
 Ethiopia
-
 Finland
-
 France
-
 Georgia
-
 Germany
-
 Ghana
Ghana
-
 Greece
-
 Haiti
Haiti
-
 Hong Kong
-
 Hungary
-
 India
India
-
 Indonesia
-
 Iran, Islamic republic
-
 Iraq
Iraq
-
 Ireland
-
 Israel
-
 Italy
Italy
-
 Jamaica
-
 Japan
Japan
-
 Jordan
-
 Kazakhstan
-
 Kenya
Kenya
-
 Korea
Korea
-
 Kuwait
-
 Kyrgyzstan
-
 Laos
Laos
-
 Latvia
-
 Lebanon
-
 Lesotho
-
 Libya
Libya
-
 Lithuania
-
 Luxembourg
-
 Madagascar
-
 Malaysia
-
 Malta
Malta
-
 Mauritius
-
 Mexico
-
 Moldova
-
 Mongolia
-
 Montenegro
-
 Morocco
-
 Mozambique
-
 Myanmar
-
 Namibia
-
 Nepal
Nepal
-
 Netherlands
-
 New Zealand
-
 Nigeria
-
 North Macedonia
-
 Norway
-
 Oman
Oman
-
 Pakistan
-
 Palestine
-
 Panama
-
 Papua New Guinea
-
 Paraguay
-
 Peru
Peru
-
 Philippines
-
 Poland
-
 Portugal
-
 Puerto Rico
-
 Qatar
Qatar
-
 Reunion
-
 Romania
-
 Rwanda
-
 Saudi Arabia
-
 Serbia
-
 Singapore
-
 Slovakia
-
 Slovenia
-
 Somalia
-
 South Africa
-
 Spain
Spain
-
 Sri Lanka
-
 Sweden
-
 Switzerland
-
 Syria
Syria
-
 Taiwan
-
 Tajikistan
-
 Tanzania
-
 Thailand
-
 Trinidad and Tobago
-
 Tunisia
-
 Turkey
-
 UAE
UAE
-
 Uganda
-
 Ukraine
-
 United Kingdom
-
United States
-
 Uruguay
-
 Uzbekistan
-
 Venezuela
-
 Vietnam
-
 Yemen
Yemen
-
 Zambia
-
 Zimbabwe
- Forex
- Crypto
